Login

Trends analysis with price

Chapter 3

Trends Analysis with Price 

Trend Analysis using Price

Trend analysis is an approach to forecast the underlying, i.e.  Nifty/Bank Nifty/F&O stocks, prices and the future trajectory. The analysis involves the study of historical price data points and volume to forecast or gauge the sentiment/ market interest in the underlying. It is a technique, which forms a pivotal part of technical analysis, broken down into 3 time horizons, namely, long term, intermediate term and short term.


The three trends which are used to map the price action are upward, downward and sideways.


How to characterise these trends?

Upward:  As discussed in Dow theory, upward trend is when historical prices move along a direction forming higher tops and higher bottoms. This is also called a bull trend, if trend persists for medium to long term.

Downward: Contrary to the upward trend, historical prices, when they move along a direction, forming lower tops and lower bottoms, called a bear trend in the intermediate to long term.

Sideways: It is also referred to as horizontal trend, occurs when no decisive direction emanates from the recent historical price action. It also, implies that the underlying price or other examined metrics and variables are stagnant or range -bound.

Before discussing about trading strategies using trend analysis, it would be wise to discuss about support and resistance.

The price action is a function of demand and supply. Also, when demand for a stock or an underlying is more than the supply, prices will drift higher. Support and resistance are two important concepts in technical analysis. Understanding what these terms mean and their practical application is essential to understand and read charts (Also, understanding the sentimental play).

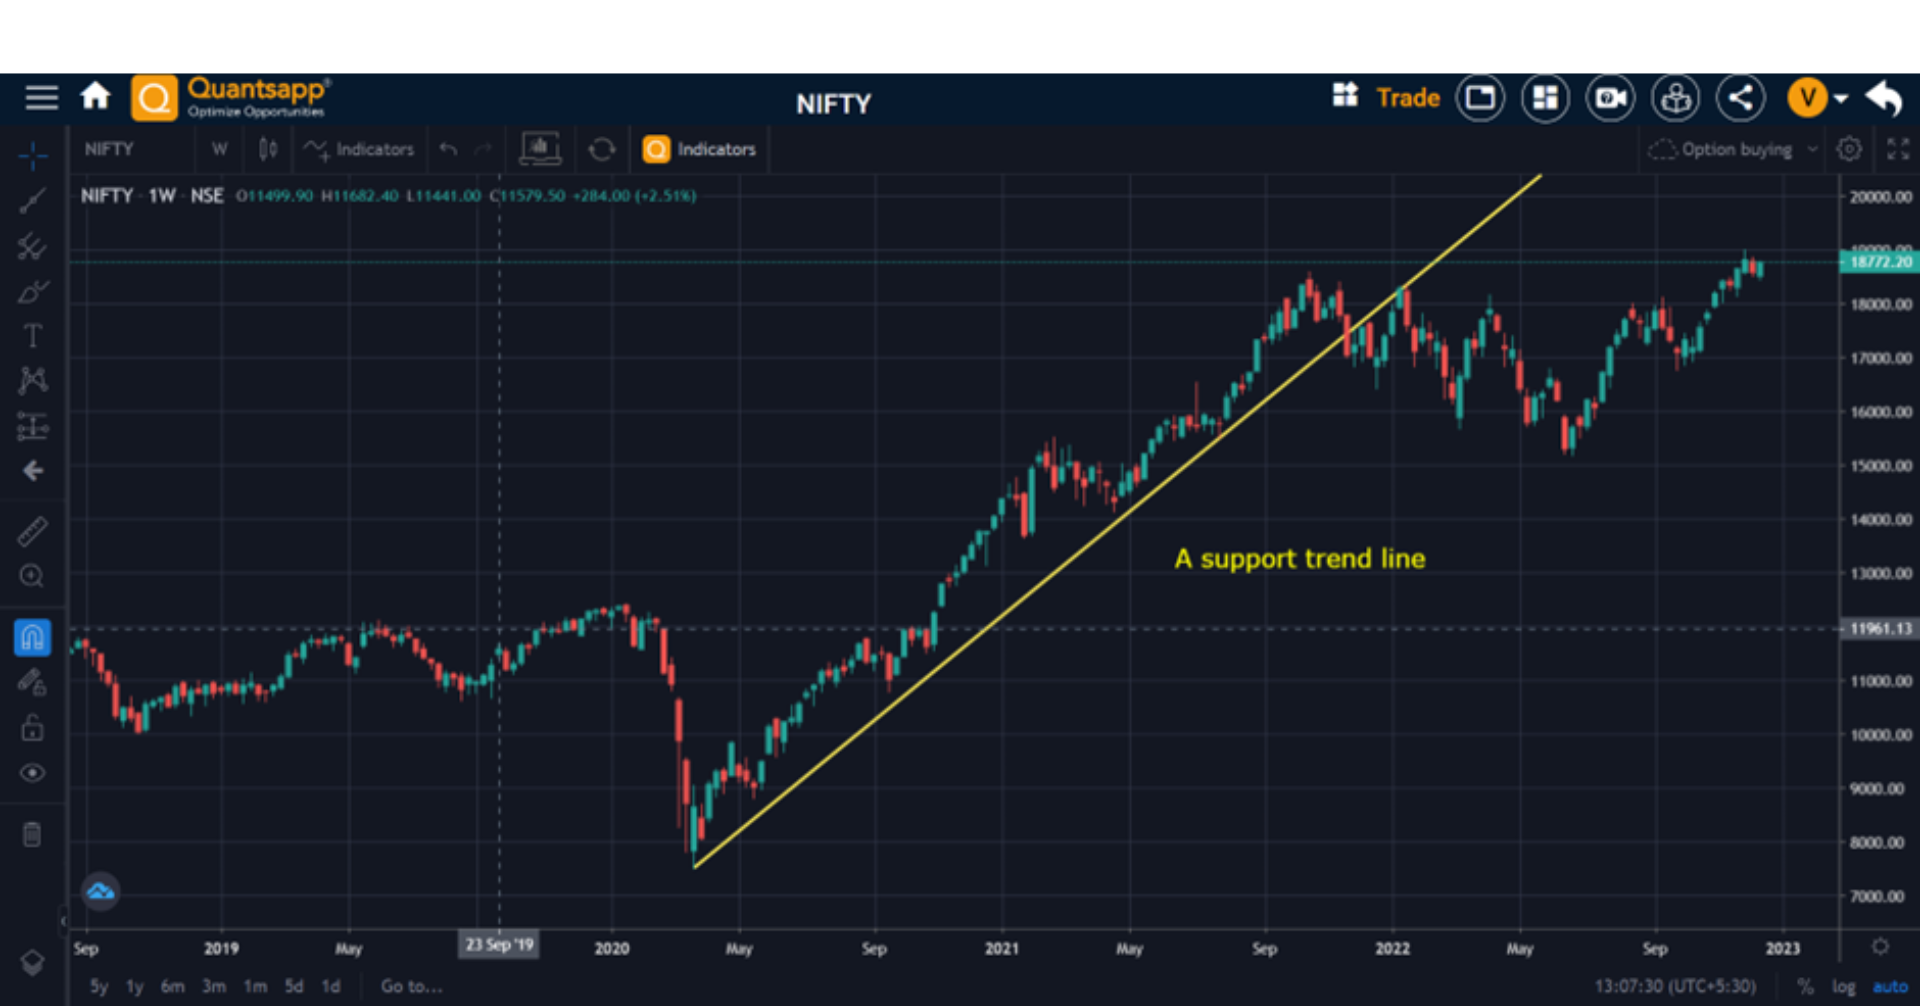
Support: In a downtrend, prices fall because there is an excess of supply over demand. The lower prices go, the more attractive, the underlying could get, for a gush of demand to come in from the buyers, there may be a point where an equilibrium point is reached where demand and supply match. This is support, it could be a price point or a zone.

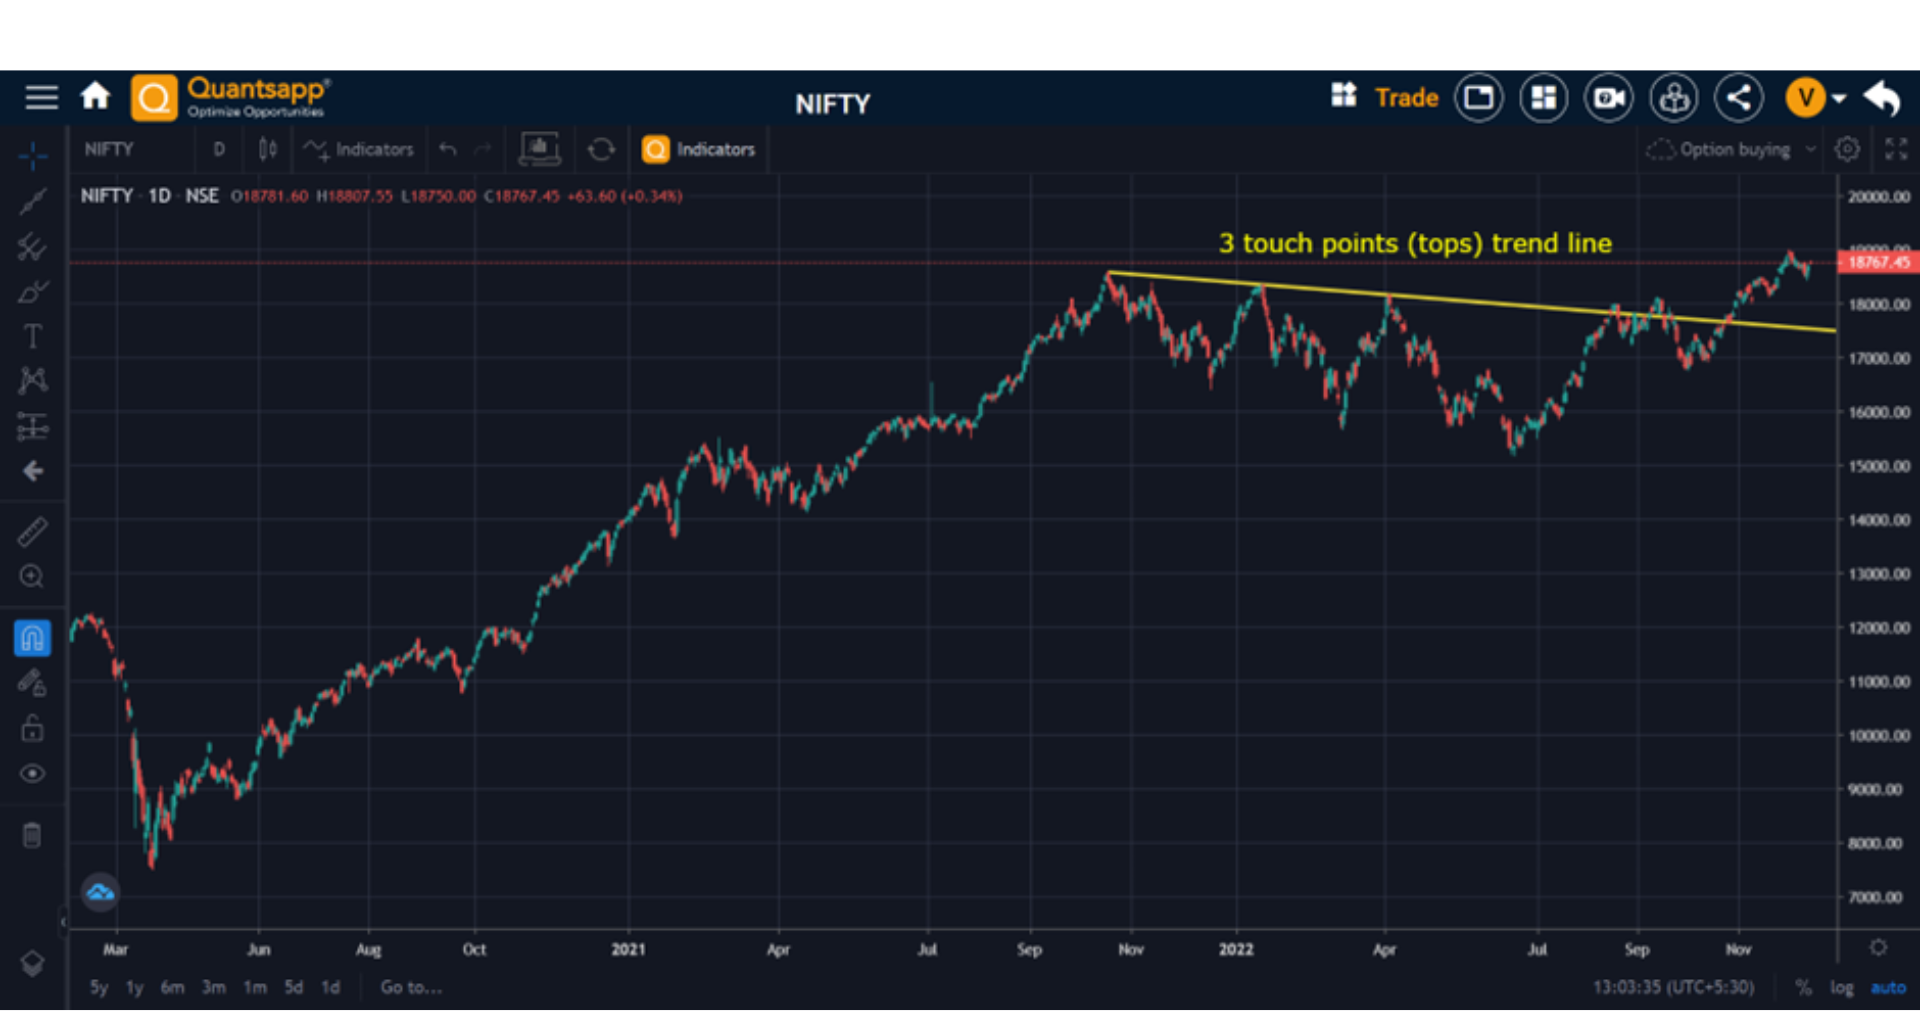
Resistance: Resistance is the opposite of support. Prices move up because there is more demand than supply. As prices move higher, there will come a point when selling will increase, till the prices reach a point, where the selling (supply) matches the buying in the underlying. This point or zone is referred to as Resistance.

Once an area or “zone” of support or resistance has been identified, those price levels can serve as potential entry or exit points because, close to the zone of resistance/support, the underlying prices will do one of two things: bounce from the support or resistance level, changing price trajectory or violate the support during a bear trend and continue falling until it hits the next technical price zone (support). While a similar nuance can be observed in a bull market, where prices rise and when reach a resistance could reverse trajectory or break out and continue its bullish fervour.


Traders juxtapose technical levels, mentioned above, with several other technical indicators including RSI, Volumes, MACD, etc. to gauge and forecast if it’s a turning point or breakout/breakdown scenario.

Trading Strategies using Trend Analysis

Moving Averages: 

When a short-term moving average crosses above a long-term moving average, it is usually a juncture where traders go long, to take advantage of a possible rising trend. They enter a short position when a short-term moving average crosses below a long-term moving average, to take advantage of a possible downward trend.

Nifty chart highlighting the 3 trends.

The Nifty chart shows 9 DMA and 21 DMA, where one can clear observe the cross-overs and gauge the trending moves for the medium term.

Nifty chart highlighting the 3 trends.

The above chart indicates Nifty with a 200 DMA (day moving average), suggestive of a long-term technical level for the index, Nifty.

Trendlines:

These set of strategies involve the trader taking a long position in the scenario where security is trending higher, i.e. higher tops and higher bottoms and placing a stop-loss below the key trendline support levels. If the stock starts to reverse, the trader exits the position to book a profit.

The contrary holds true for a bearish move, where the tops are connected or joined together to form a trend line resistance level, a breach of which may be suggestive of the onslaught of bulls and if the trend starts to reverse, bearish traders might exit.

Nifty chart highlighting the 3 trends.

The above chart indicates a trend line which has been constructed using 3 tops as touch points. The series of lower tops suggestive of it as a bearish trend line.

Nifty chart highlighting the 3 trends.

A support trend line has been drawn in the above weekly chart of Nifty, connecting multiple lows. A decisive break of a support trend line during an up-move, is suggestive of an upcoming change in trend to either, sideways or downward.

What, next? We studied about price, but its about time we moved our attention to some derivative data, especially open interest, OI charts and its observations.

FAQs

What is trend analysis?

Trend analysis is an approach of forecasting the underlying, i.e.  Nifty/Bank Nifty/F&O stocks, prices and its future trajectory. The analysis involves the study of historical price data points and volume to forecast or gauge the sentiment/ market interest in the underlying.

What are the 3 types of trends?

The three types of trends are stated ahead:

Upward:  It is also referred to as bull trend, if persists long.

Downward:  The historical prices, when they move along the southward direction are said to be in a bear trend, if were to persist in the intermediate to long term.

Sideways: It occurs when no decisive direction is taken by the prices, or range-bound price action.

How do you analyze price trends?

Price trends can be analysed using few indicators like moving averages, trend lines which help in deciding the mood of the underlying. There are several techniques which involve studying price action for suitable decision making, as far as trading goes.

When volatility is expected to jump or increase, traders usually opt for long straddles/strangles, while if volatility is expected to shrink or reduce from elevated levels, traders sell options like short straddle or strangle and hedge by buying OTM puts and calls.