So, after having studied price behaviour and trend analysis using price action, its time to focus on derivative data points, especially open interest.
Ideas
Ideas
.svg)
Intel Junction
Trade
Trade
Orders API
Watchlist
Orders
Positions
Broker Access
Hot Keys
Alert Trigger Order (ATO)
Bracket Order
Target Stoploss Order
Add Broker
Track
Futures OI
Options OI
News
Price & Volume
Alerts
Built-Up Breadth
Built-Up Scrip Symbol
Synopsis Futures OI
Built-Up Sectors
Top Stocks
Intraday Movers
Analyze
Charts
IV
PCR
Expiry
Price & Volume
Charts/ Order & Trade
Multi Strike OI
O&T Watch List
Strategy Chart
Scan
Hist-Futures
Hist-Options
Pairs
Built-Up Scrip OI-Historical
Built-Up Sector Cycle
Built-Up Sector OI-Historical
Built-Up Scrip Cycle
Comparative Analysis
Tools
Easy Strategy
Strategy Builder
Quant Models
Essential Tools
Optimizer Find Strategy
Optimizer Find Specific
Optimizer My Forecasts
Optimizer Constrains
Learn
Live
Self Learning
Events
Webinars

Book a Session


Chapter 4
Open Interest Charts

OI Charts, unfolding the mystery of participation
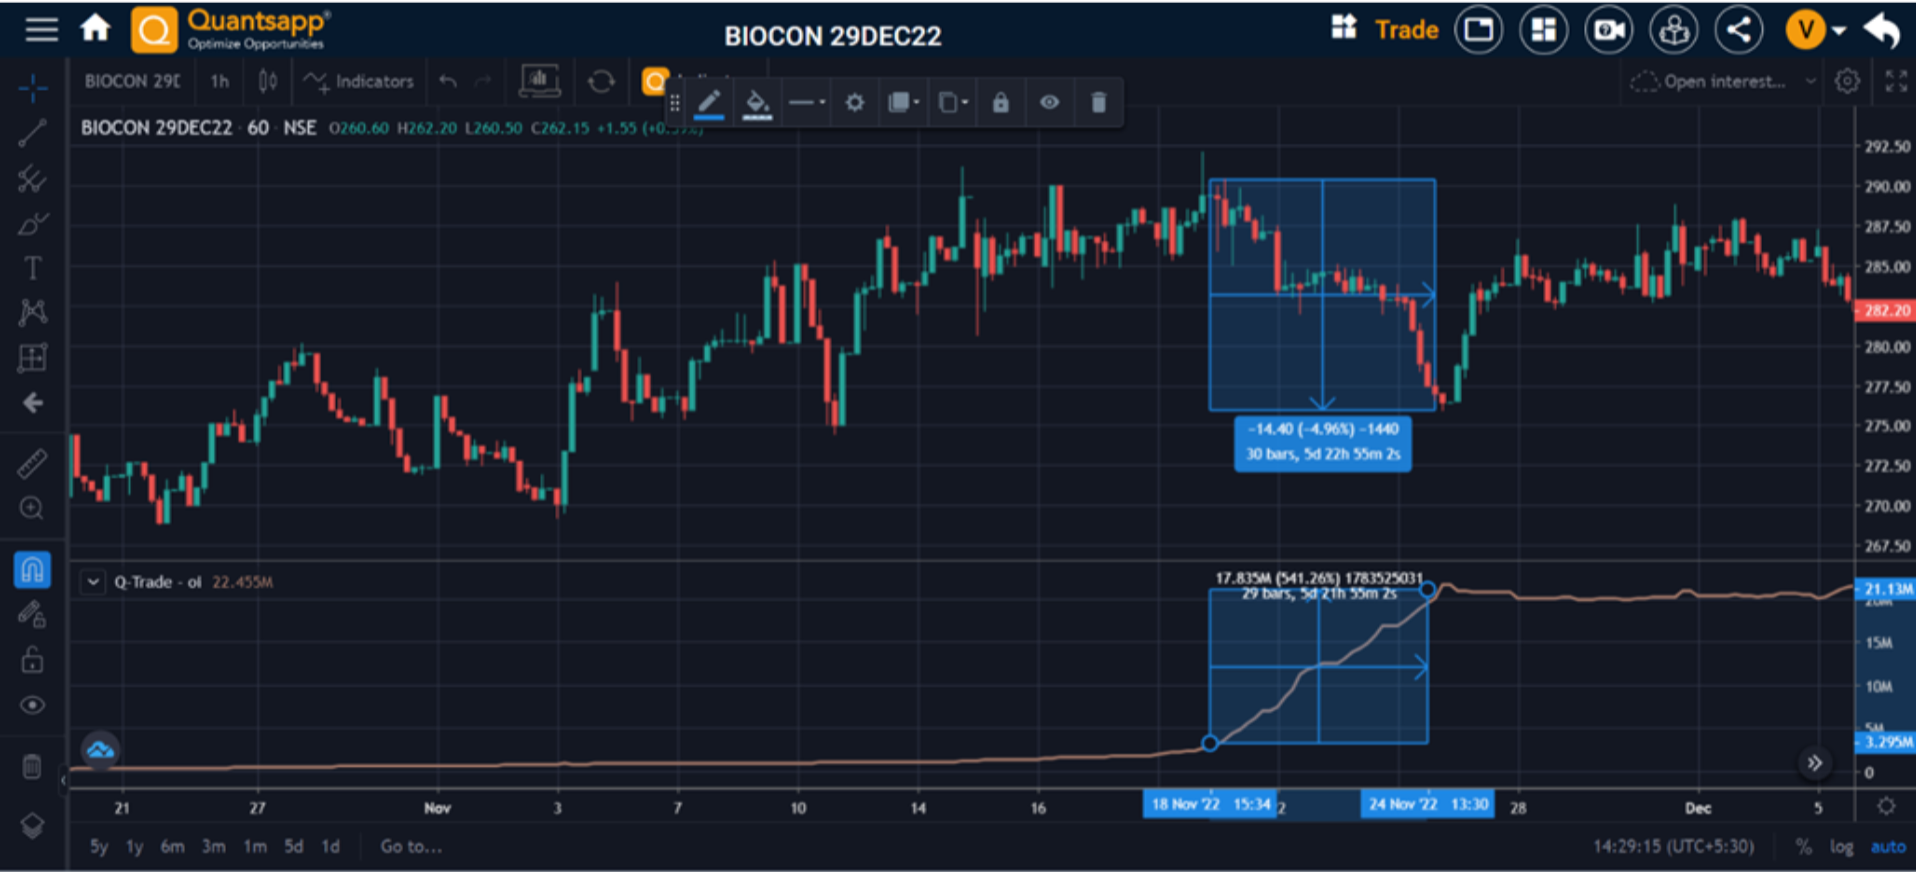
Open interest, as discussed in earlier module, indicates the number of outstanding or unsettled contracts of a particular derivative instrument. It is a metric or data point that helps gauge the traders’ participation in an underlying. Rising Open Interest points at rise in the trading interest in the underlying. So open interest can be tracked on live-basis in Quantsapp, both from the futures/underlying basis and also strike wise, in case of options.
Long built-up
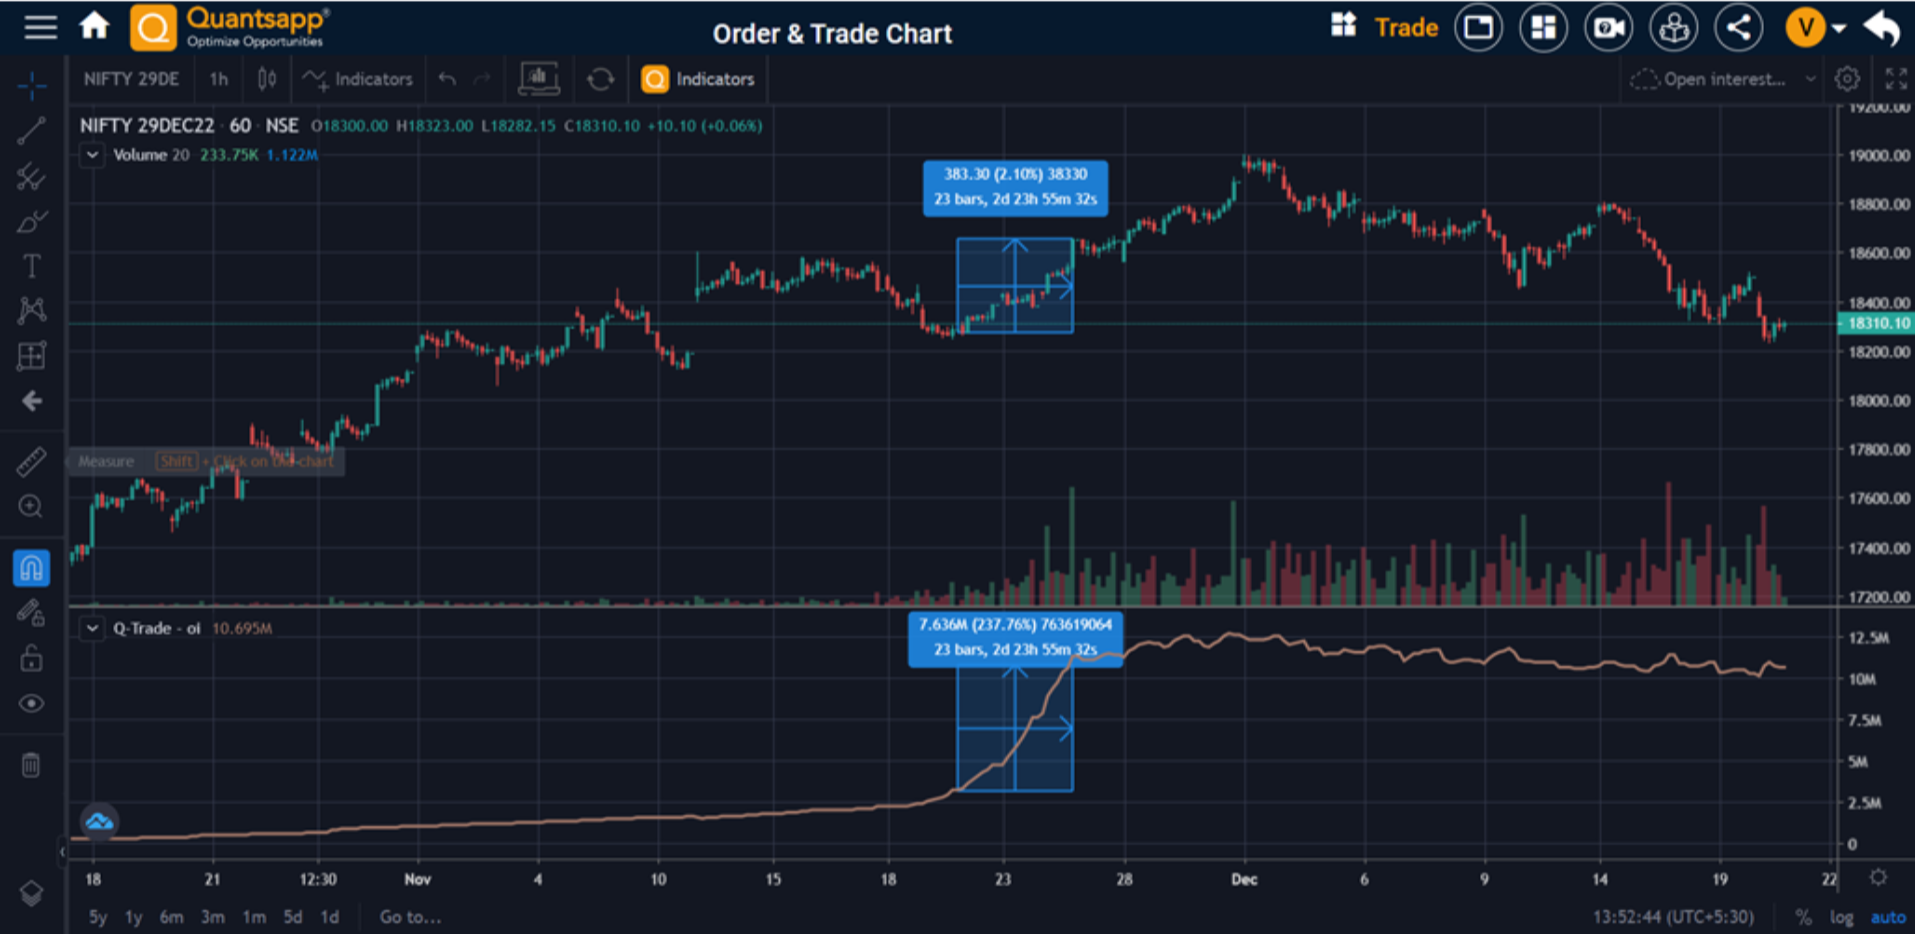
Short built-up
Long unwinding
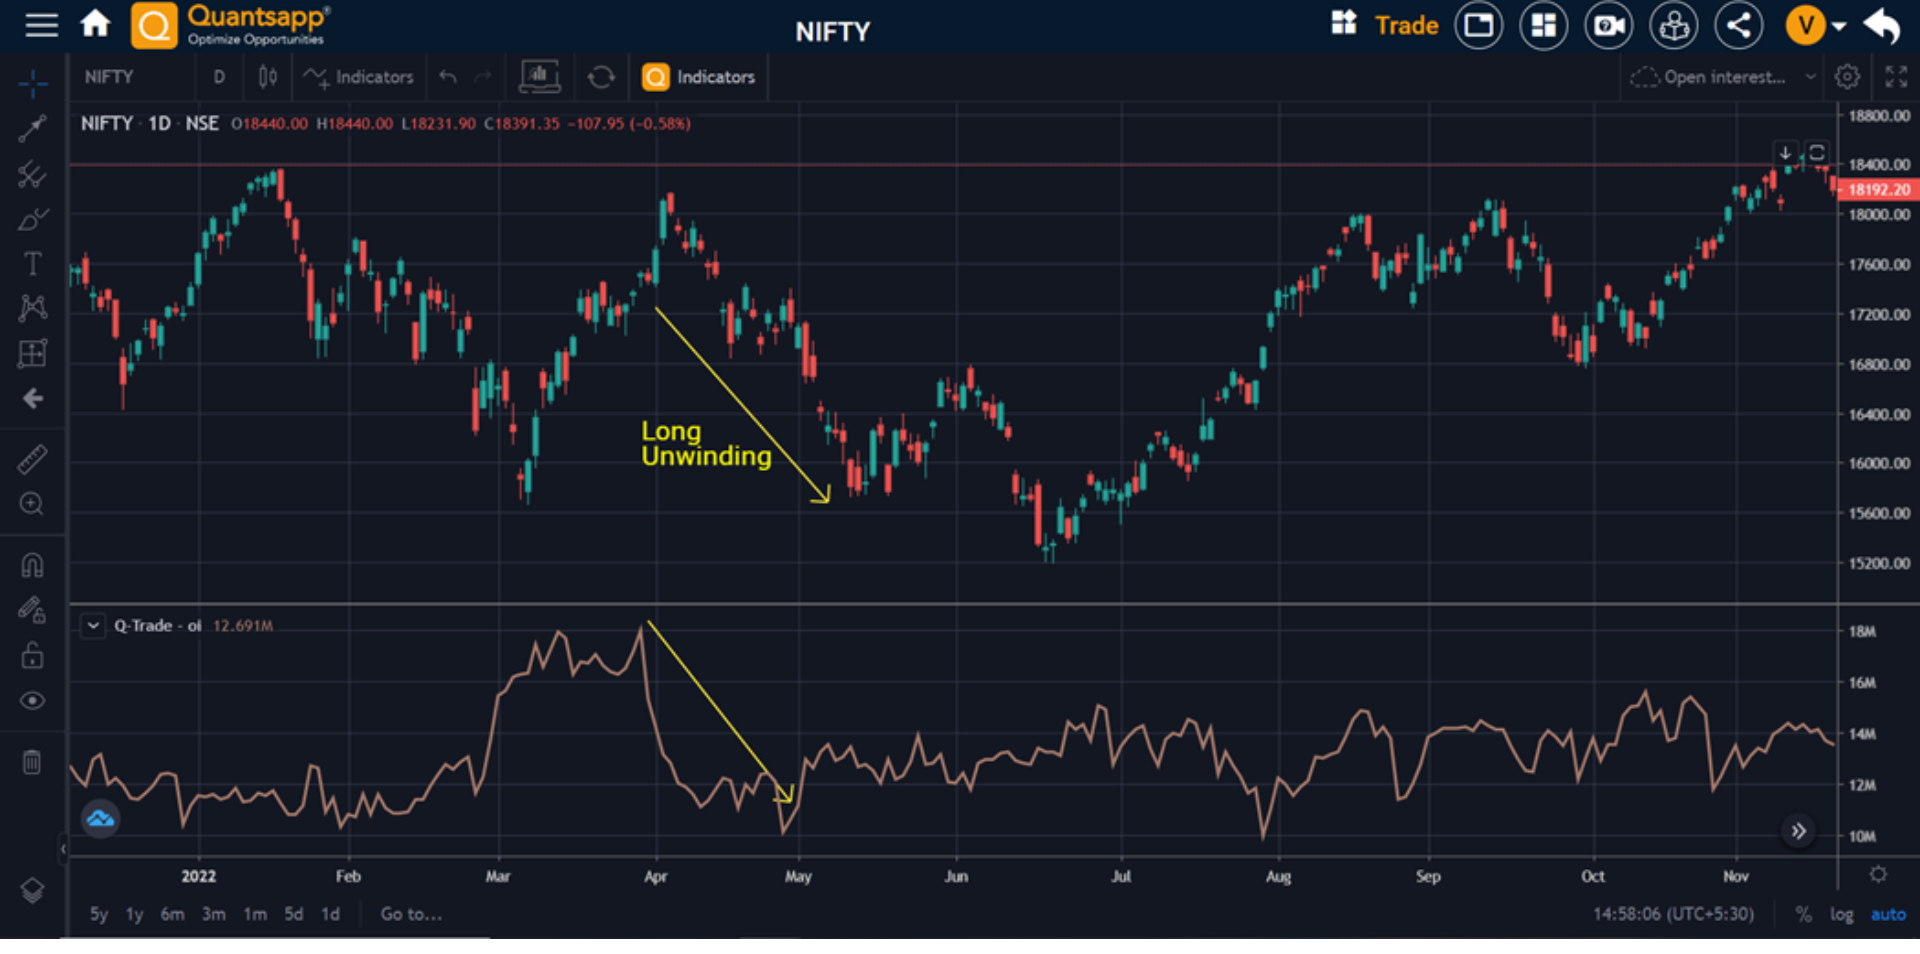
The drop in prices and also a similar trend in OI, as shown in the daily chart of Nifty and its OI, suggest a short-term bearish pause in a rally, also termed as Long unwinding.
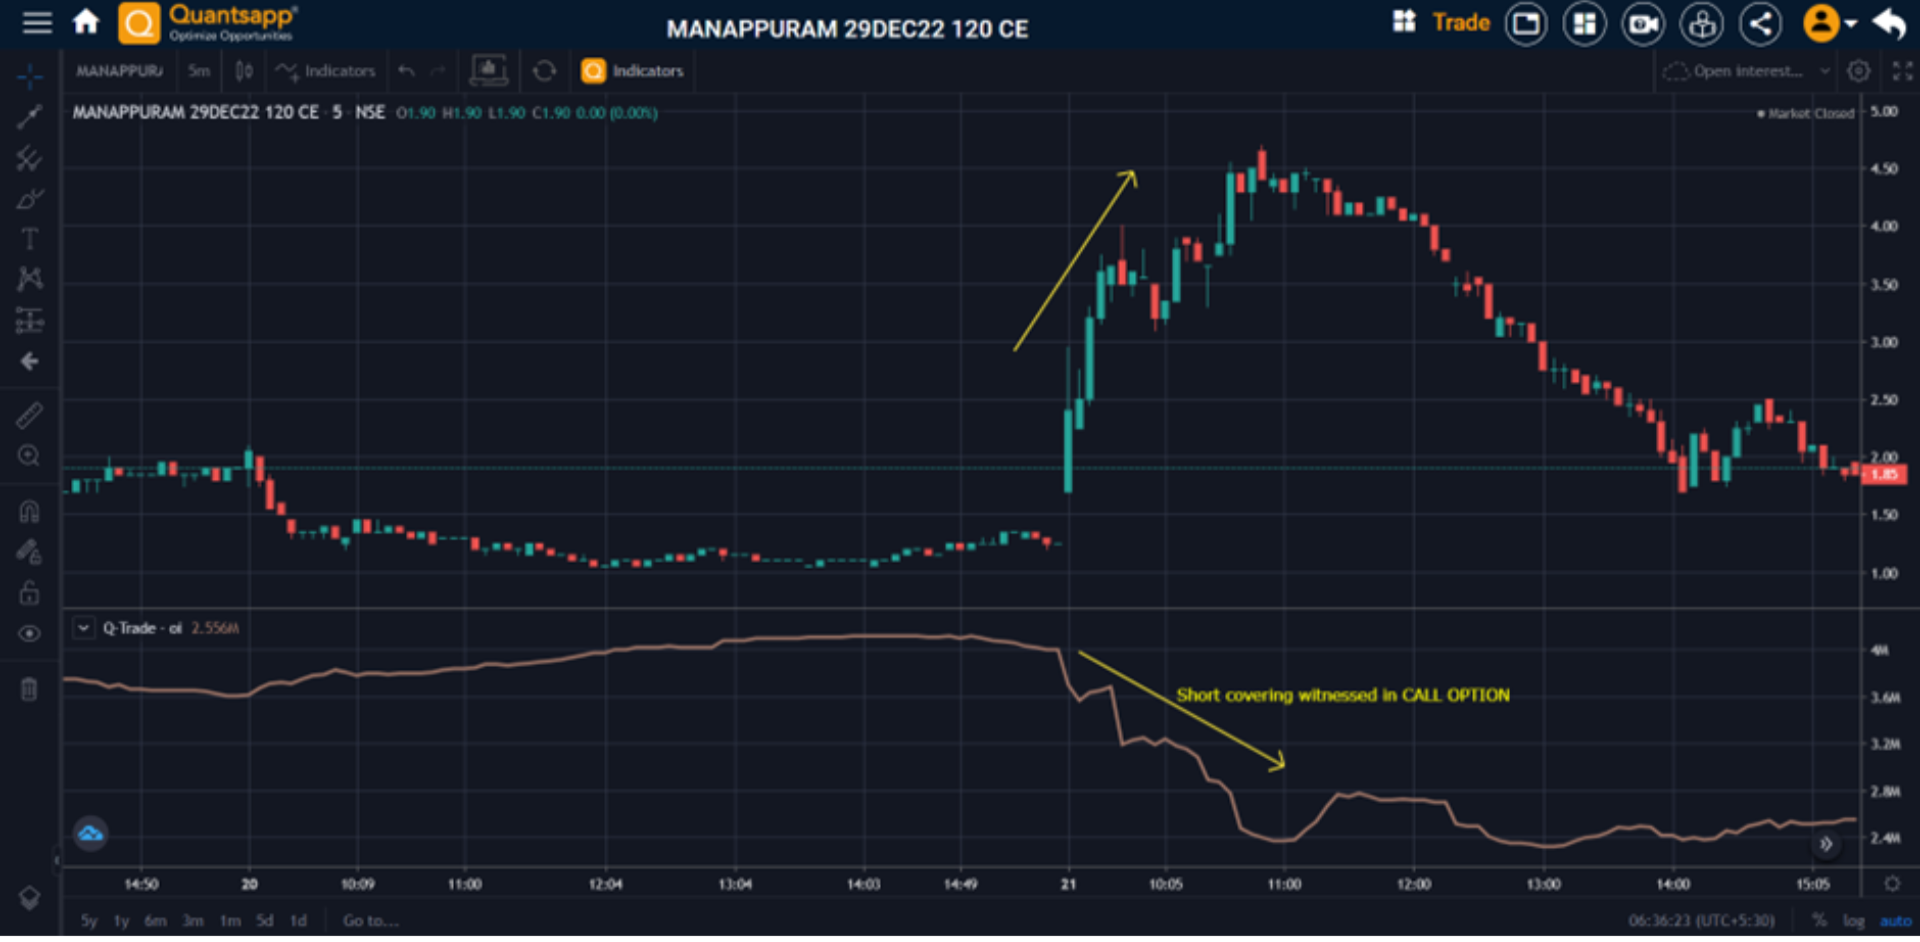
Short Covering
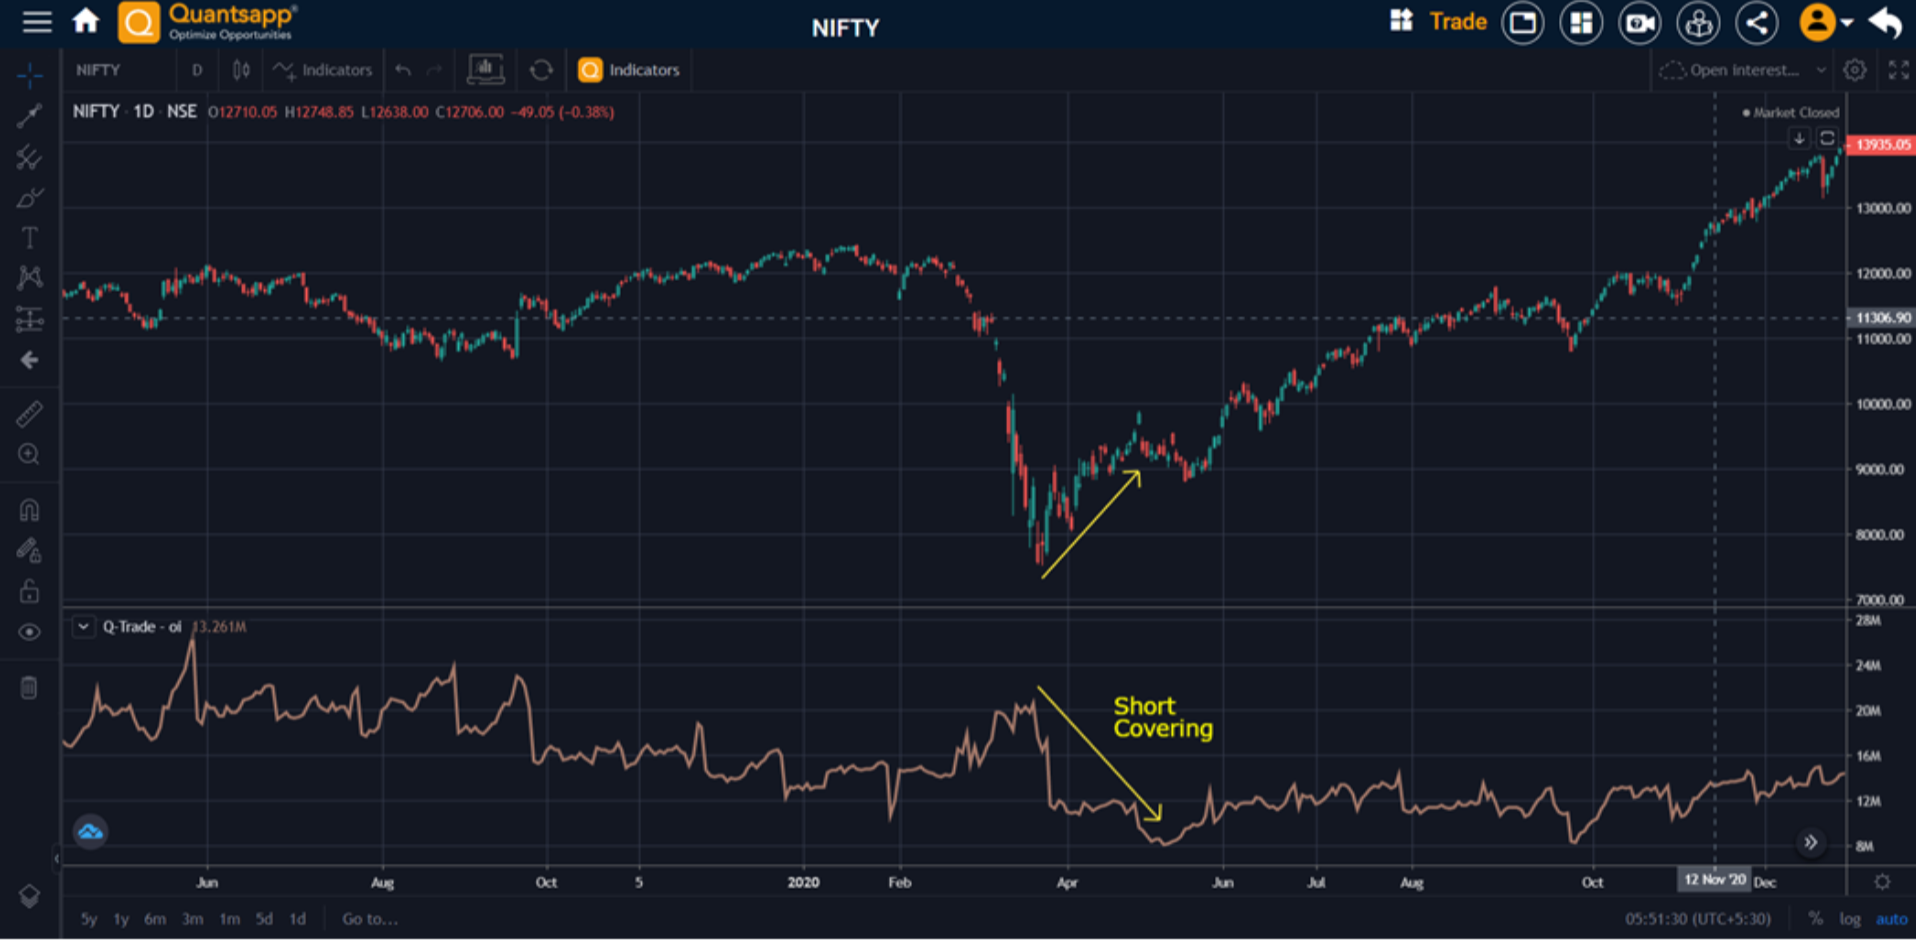
The drop in open interest and the simultaneous rise in prices suggest that there was a bout of short covering in the Nifty index, which in the short-term trading suggests that the bounce could be sharp from the lows, until there is a reasonable drop in open interest, OI.
Money Spinner
When prices of an underlying like Nifty, BankNifty or F&O stocks, move closer to the HIGHEST OI strike call option (which is supposed to act as a resistance), there exists a possibility of ATM strike option price breakout, at that juncture, provided there is open interest unwinding (short covering), in the particular option. This entails buying that Highest OI strike call option, under such circumstances.
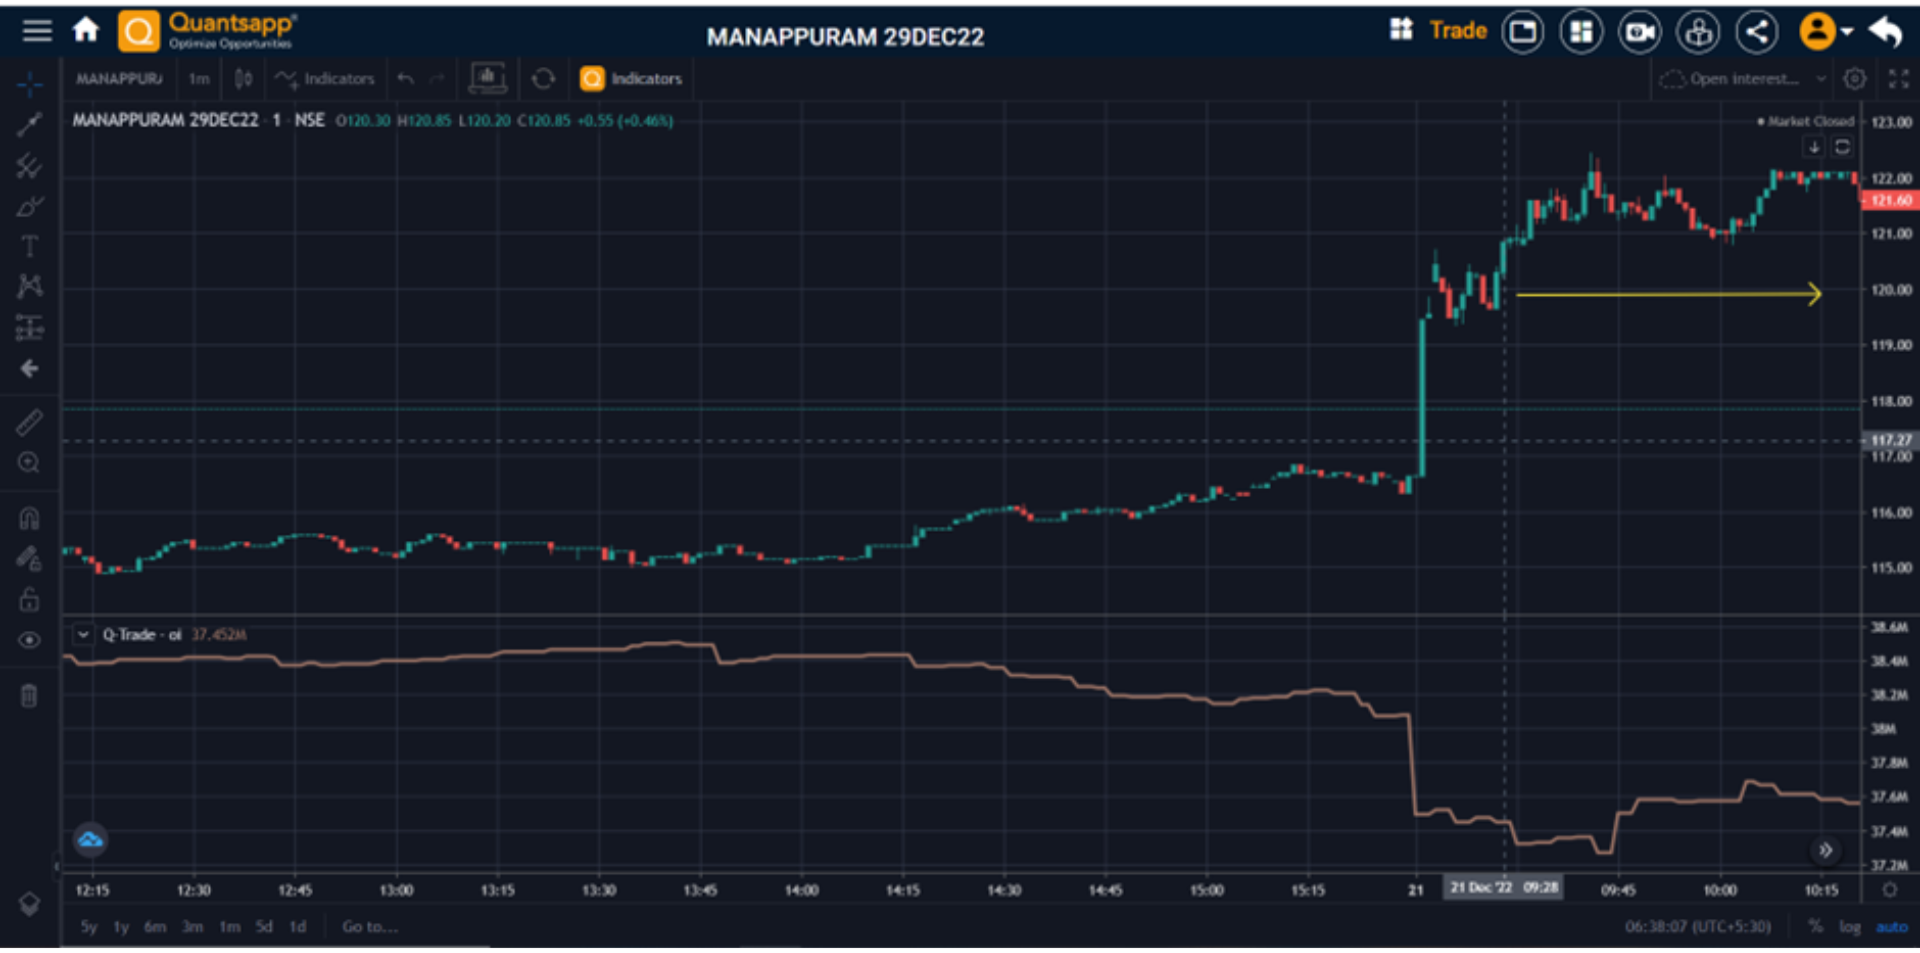
Manappuram quotes at about Rs 120 , 21st Dec 2022, at 9:20 am. The lower chart indicates as the prices of underlying inch higher, there comes a wave of short covering in 120 CE of Manappuram. This is where the Option sellers are trapped intraday basis and the option prices can move with a large swing to create wealth for the option buyers of Manappuram 29 Dec 2022 120 CE.
Open interest forms an important derivative data point to peruse, looking forward to option strategy charts.
FAQs
What does OI data indicate?
OI or Open interest data indicates the number of open contracts in a particular derivative instrument. It indicates the participation, liquidity and sentiments at play.
How do you analyze OI data?
Open interest data is studied with price action data, in order to decide the prevailing interrelationship at the current juncture.
Increase in OI, with price increase suggests, fresh participants are going long.
Increase in OI, with price decrease suggests, fresh participants are going short.
Decrease in OI, with price decrease suggests, participants are squaring off their longs. (Long Unwinding)
Decrease in OI, with price increase implies, participants are squaring off their short positions. (Short covering)
What does increase in OI indicate?
The open interest increase, if happens with price increase of the financial derivative instrument, means longs are getting built. While open interest increase with price drop indicates that fresh participants are going short on the financial instrument like Nifty index futures or BankNifty or NSE F&O stocks. The increase in OI, open interest, indicates fresh participants are trading now.
How do you analyze OI data?
In case of futures, the inter-relationship of price action and open interest change is studied to analyze Open interest data. This acts as a base for overlay of options trade.