The western techniques like the Dow theory in technical analysis, when used in conjunction with Japanese techniques of candle sticks, gives better insights and proves to be more effective in forecast. Here in this chapter, we focus on candle sticks.
Ideas
Ideas
.svg)
Intel Junction
Trade
Trade
Orders API
Watchlist
Orders
Positions
Broker Access
Hot Keys
Alert Trigger Order (ATO)
Bracket Order
Target Stoploss Order
Add Broker
Track
Futures OI
Options OI
News
Price & Volume
Alerts
Built-Up Breadth
Built-Up Scrip Symbol
Synopsis Futures OI
Built-Up Sectors
Top Stocks
Intraday Movers
Analyze
Charts
IV
PCR
Expiry
Price & Volume
Charts/ Order & Trade
Multi Strike OI
O&T Watch List
Strategy Chart
Scan
Hist-Futures
Hist-Options
Pairs
Built-Up Scrip OI-Historical
Built-Up Sector Cycle
Built-Up Sector OI-Historical
Built-Up Scrip Cycle
Comparative Analysis
Tools
Easy Strategy
Strategy Builder
Quant Models
Essential Tools
Optimizer Find Strategy
Optimizer Find Specific
Optimizer My Forecasts
Optimizer Constrains
Learn
Live
Self Learning
Events
Webinars

Book a Session


Chapter 2
An Approach to Understanding Candlestick Charts

An Approach to Understanding Candlestick Charts
What are candlesticks?
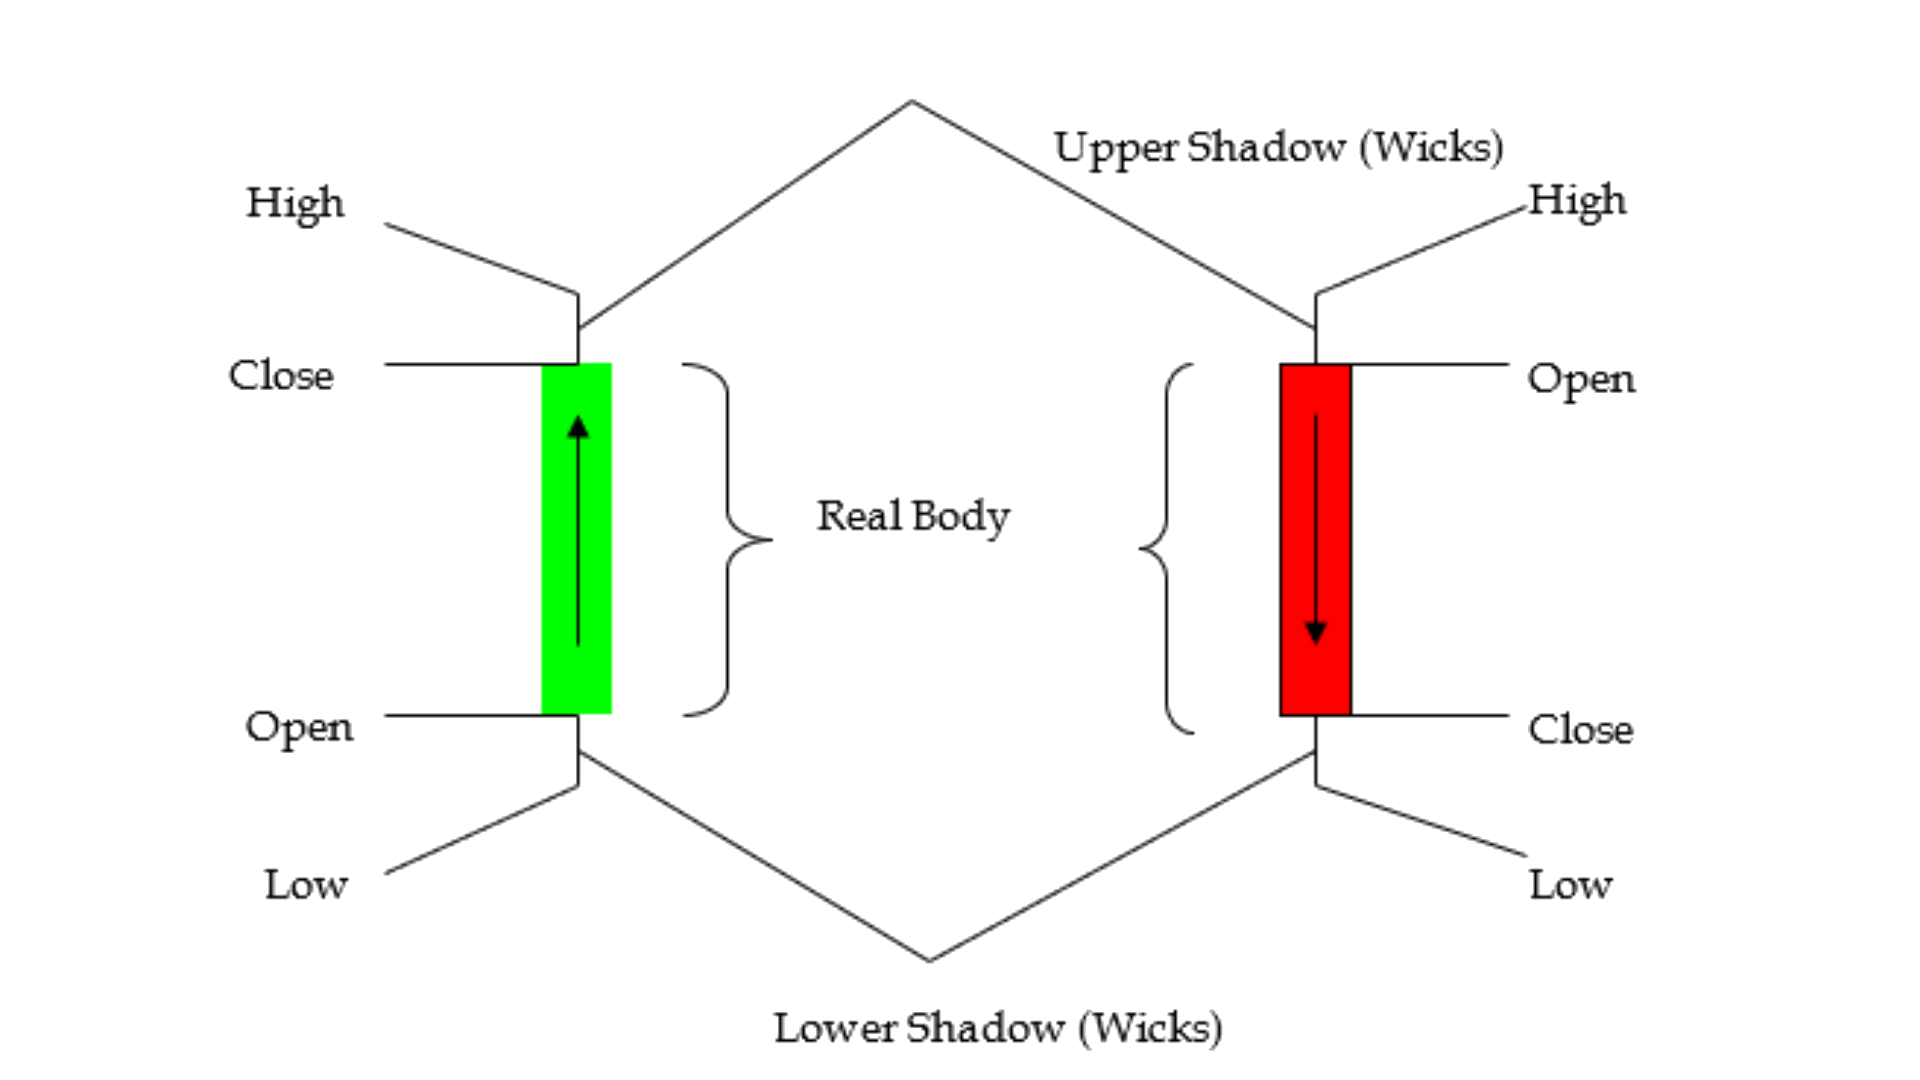
Having originated in Japan, also called Japanese candlesticks. The sentimental aspect or mass psychology of the markets is visible through these candle sticks, their size and positioning of the body as compared to the wicks. Traders use the candlesticks to forecast the short-term direction of the price, via the different candle stick patterns formed.
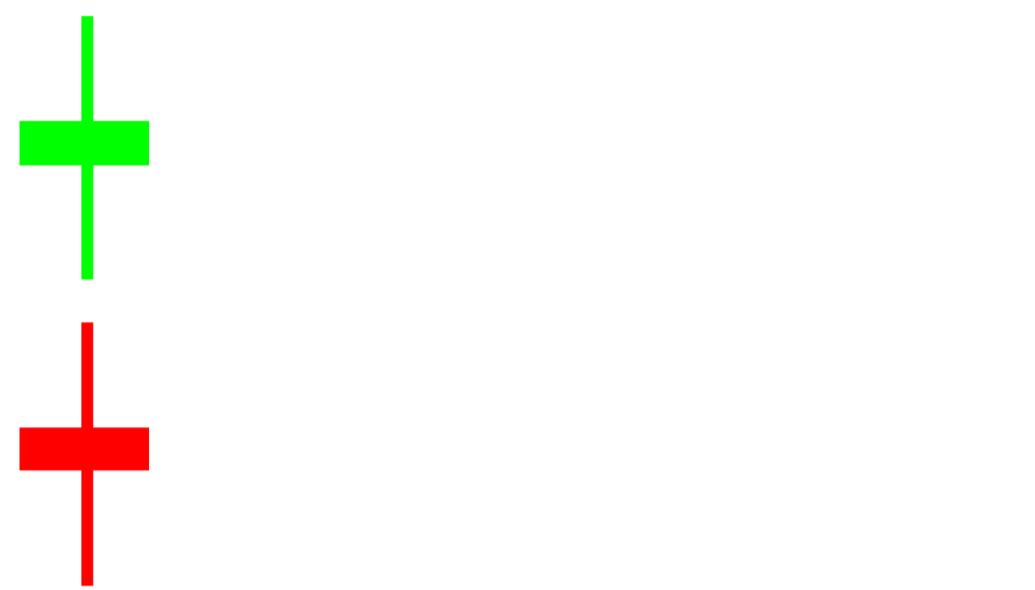
As shown in the illustration, the real body of the candle is the price range between the open and close, being red in colour if open is greater than close. It is green or bullish in colour, when close is greater than open, as indicated.
Different types of candle sticks

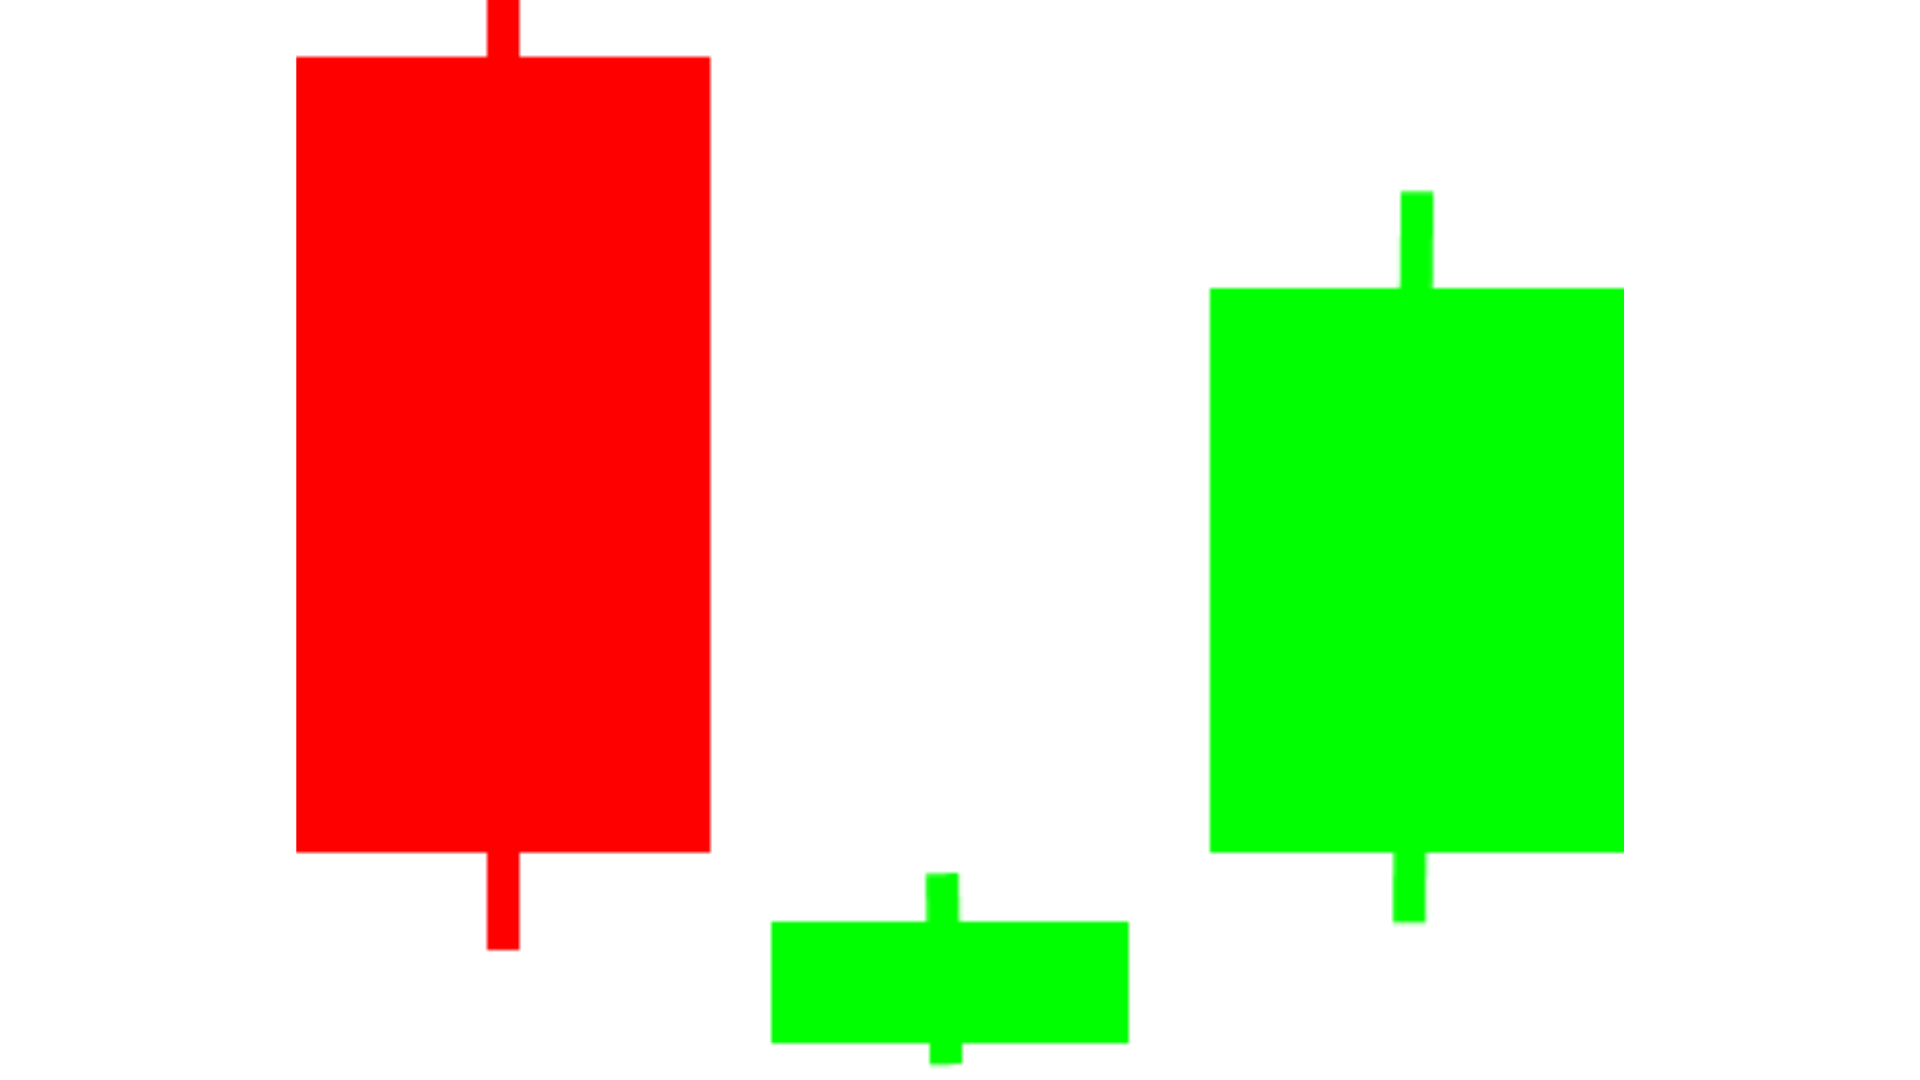
Long green candlesticks indicate that the Bulls controlled the trading for most of the moment. This indicates that prices advanced significantly from open and buyers were aggressive.

Long red candlesticks indicate that the Bears controlled the trading for most of the moment.
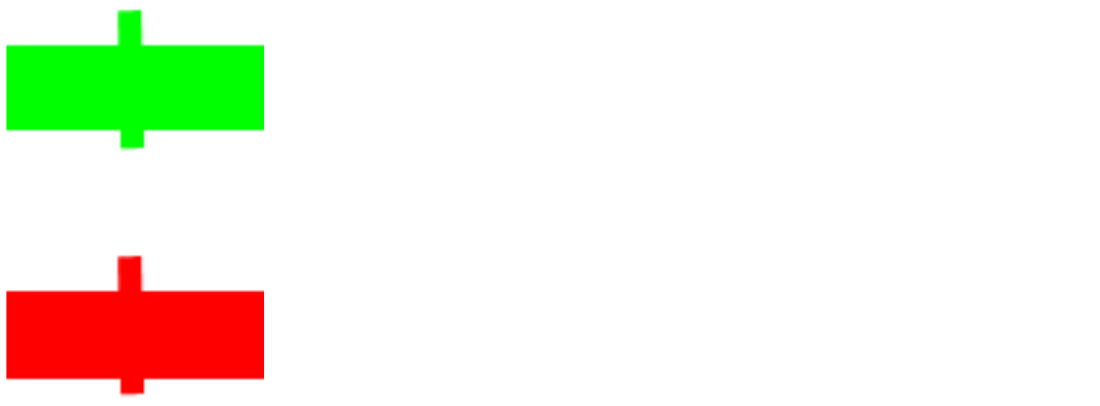
Small candlesticks indicate that neither bulls nor bears could move the trading and prices finished about where they started. Short candlesticks indicate little price movement and represent consolidation.
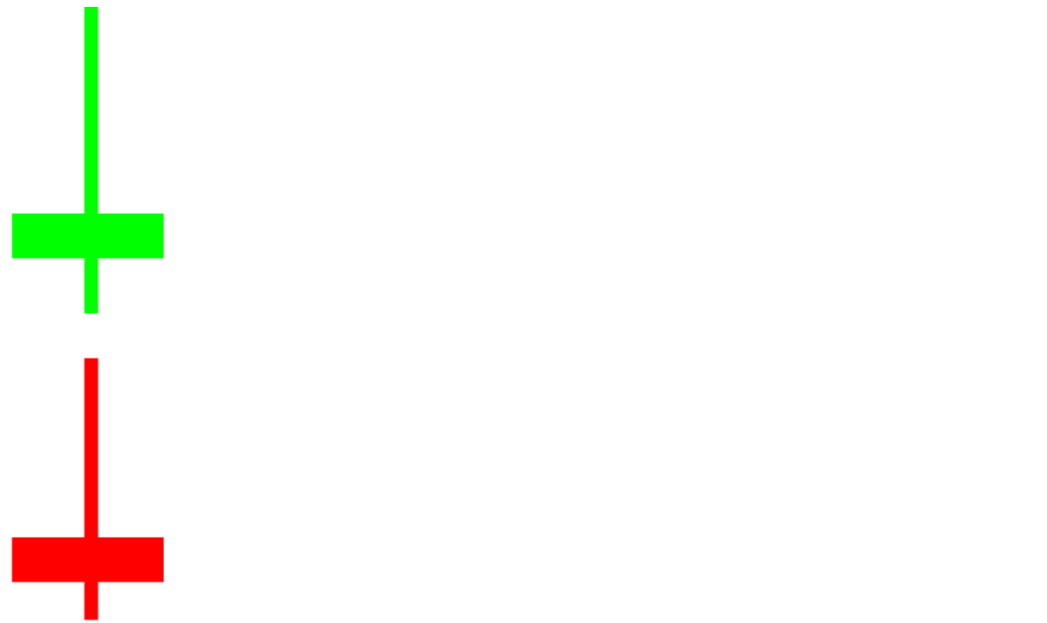
A long lower shadow indicates that the Bears controlled the moment for part of the day, but lost control by the end and the Bulls made an impressive comeback.
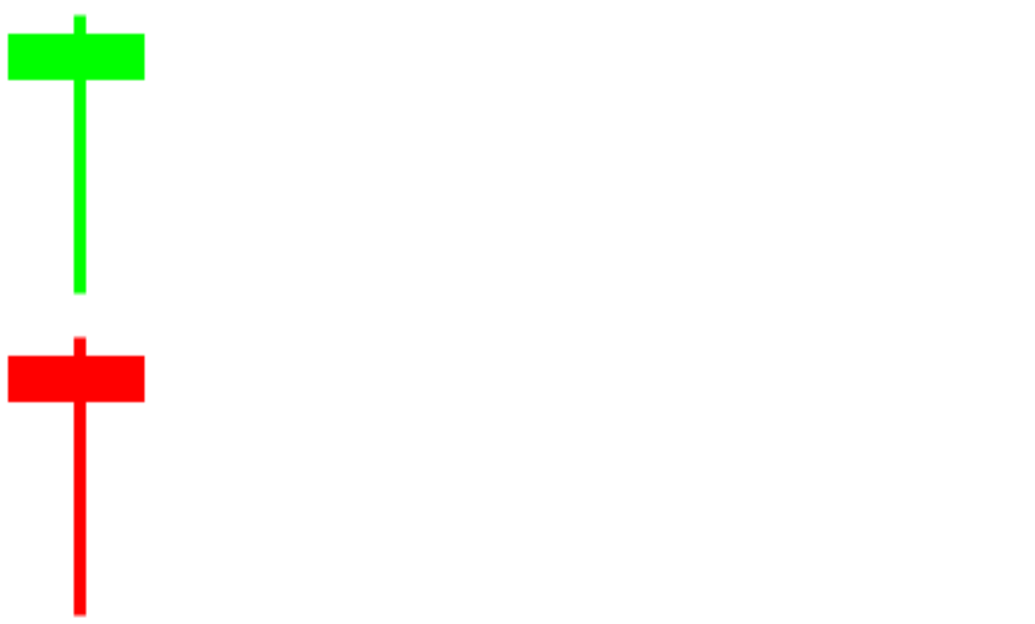
A long upper shadow indicates that the Bulls controlled the moment for part of the day, but lost control by the end and the Bears made an impressive comeback.
A long upper and lower shadow indicates that the both the Bears and the Bulls had their moments during the day, but neither could put the other away, resulting in a standoff.
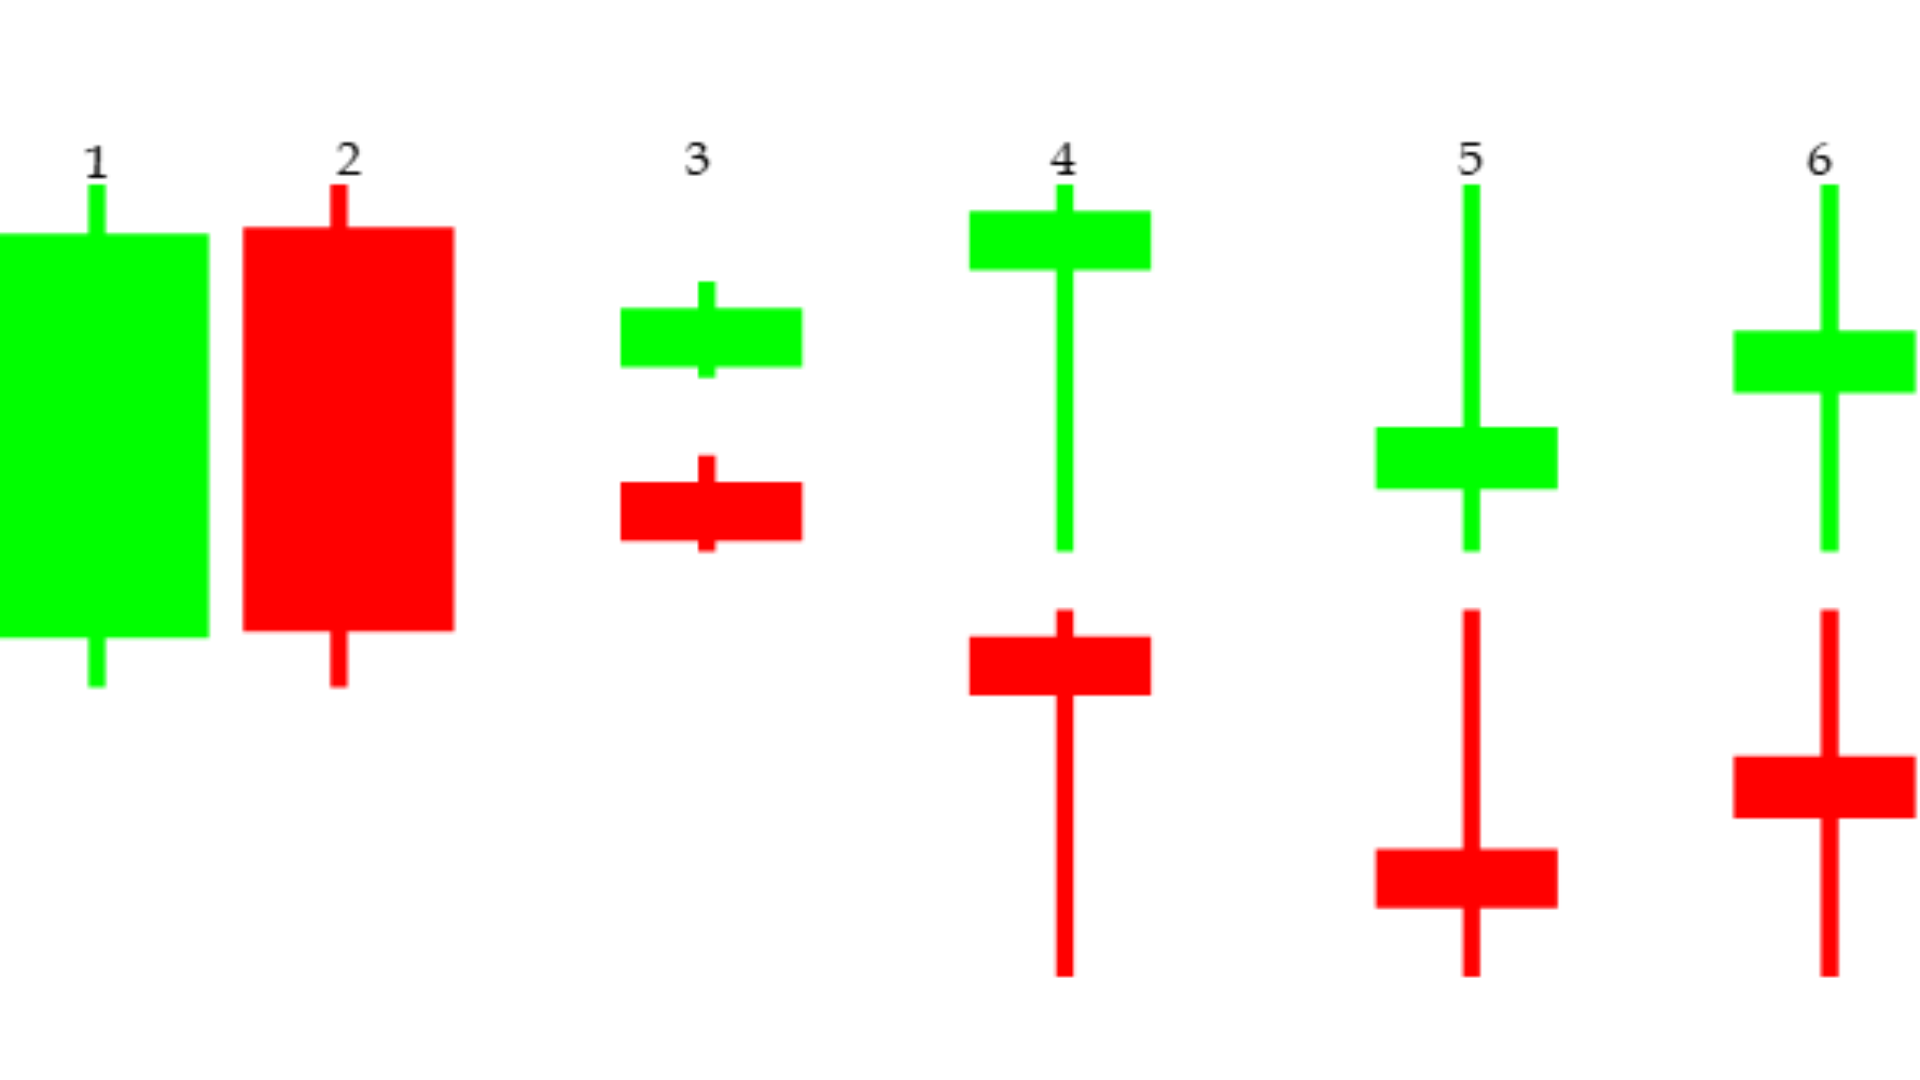
While there are many variations, But mainly 6 types candlesticks encompass a lot of market psychology.
Star candlestick and its associated patterns
A star is a small real body that gaps away from the large real body preceding it. It is still a star as long as the star’s real body does not overlap the prior real body. The star, especially the doji star, is a warning that the prior trend may be ending.
The star is part of four reversal patterns including:
1. Evening star,
2. Morning star,
3. Doji star,
4. Shooting star
In any of these star patterns the real body of the star can be green or red.
Evening Star
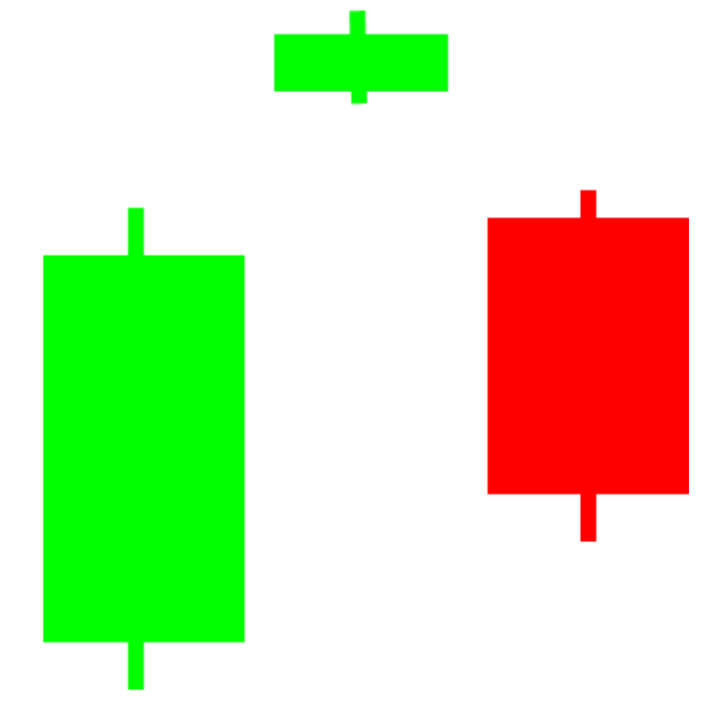
It is comprised of a tall green real body followed by a small real body which gaps up (these two lines comprise a basic star pattern). The third day is a red real body that moves well within the first session green real body. This pattern clearly shows that the market now turned bearish. An ideal evening star would have a gap before and after the middle line’s real body..
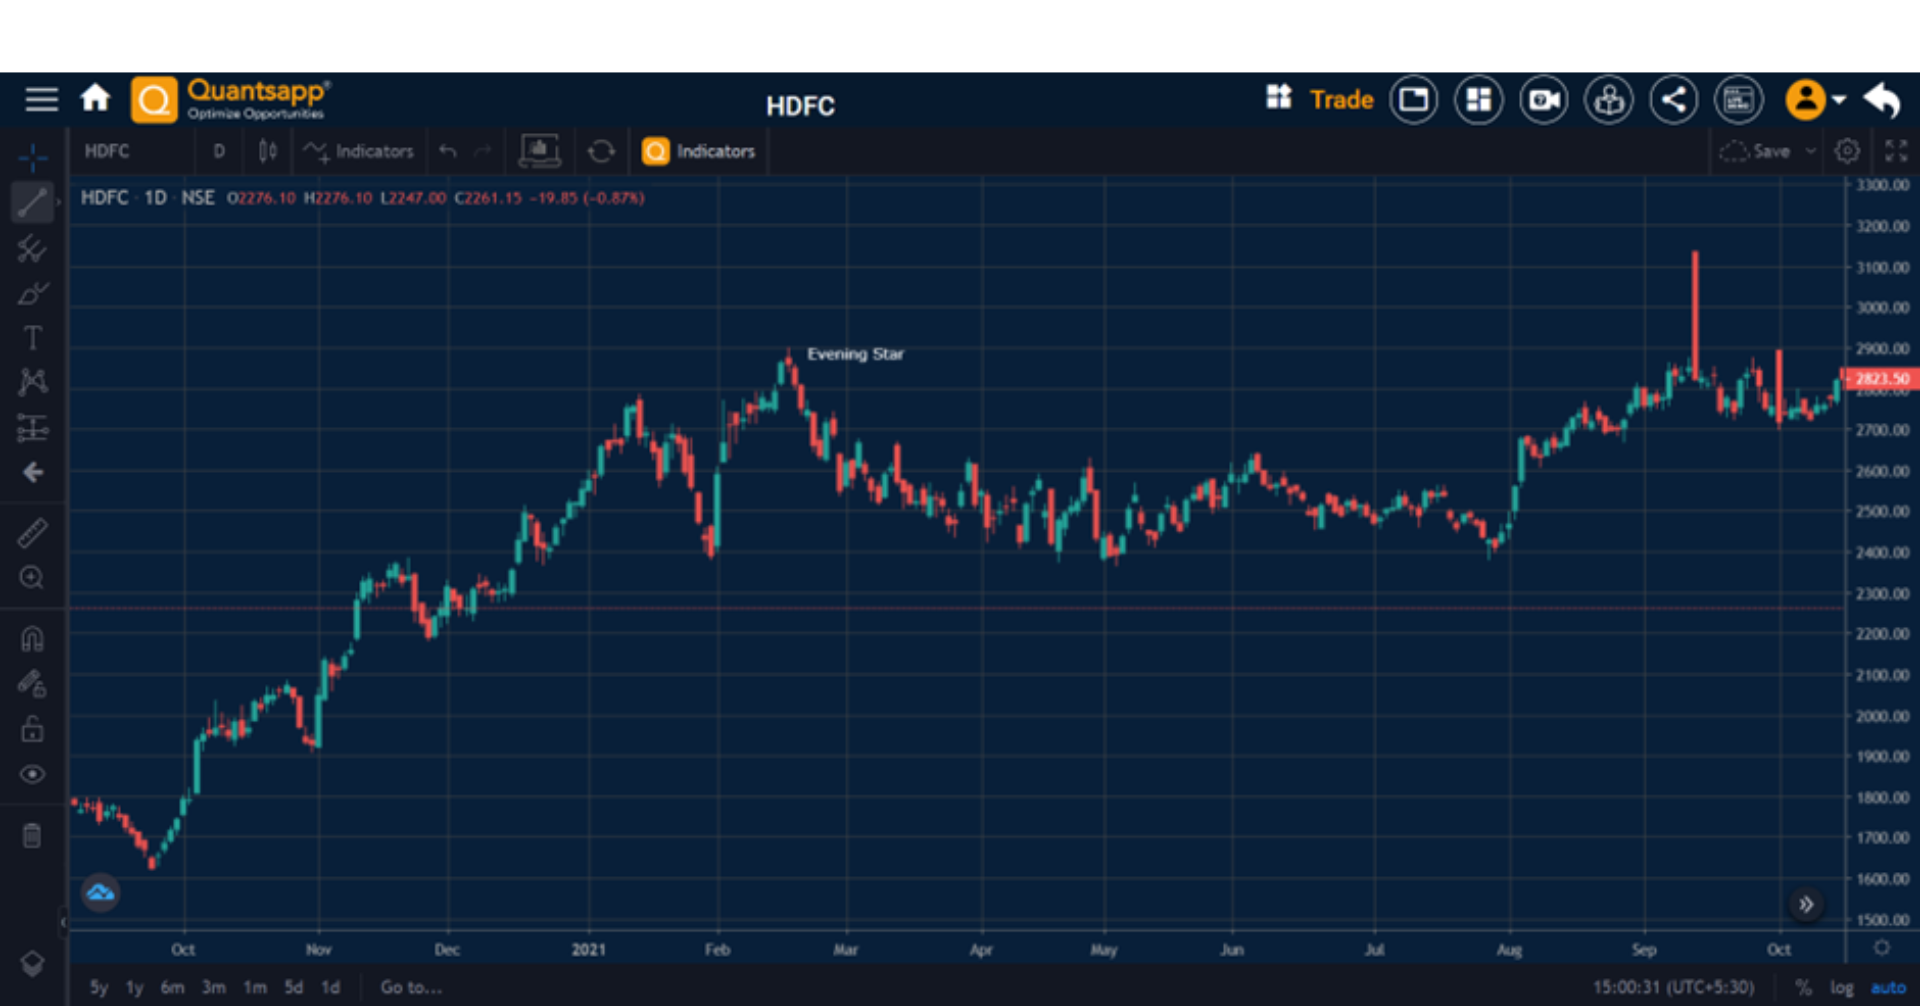
A Quantsapp chart of HDFC showing Evening star formation.
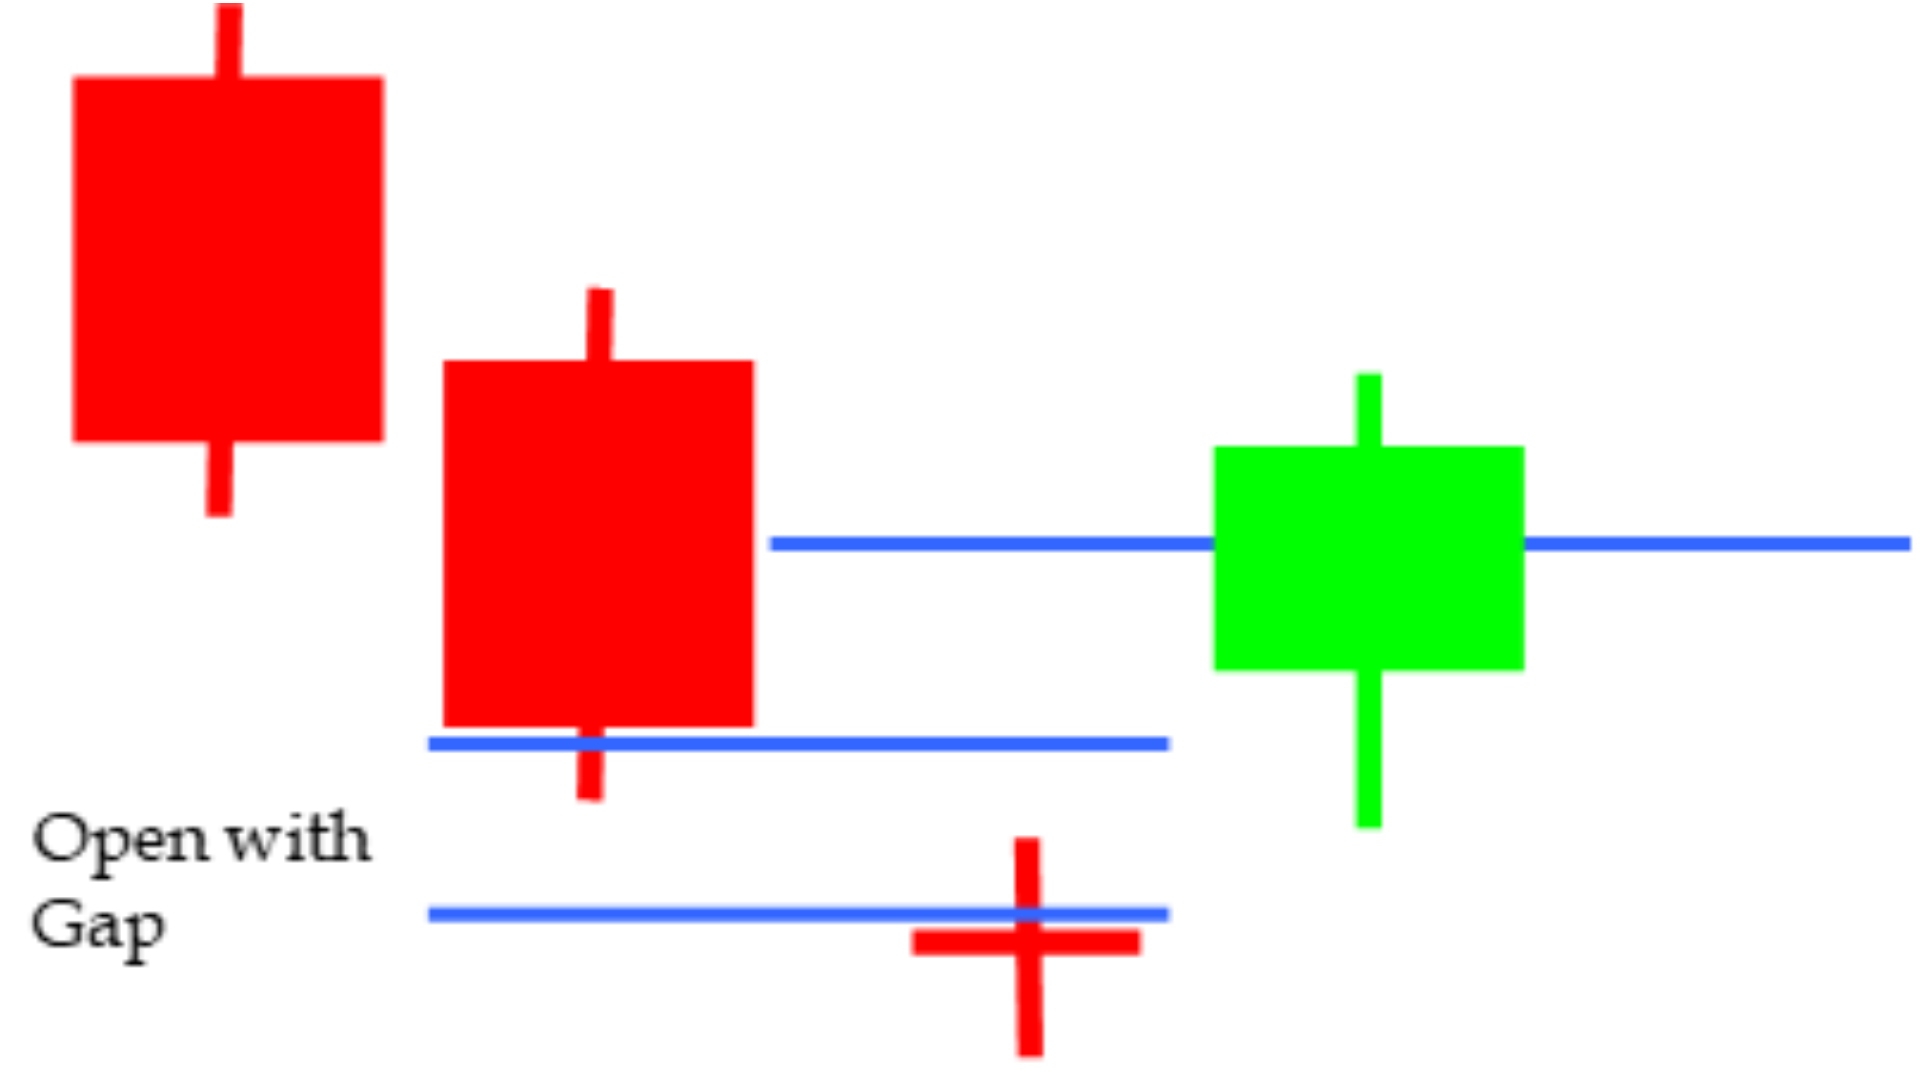
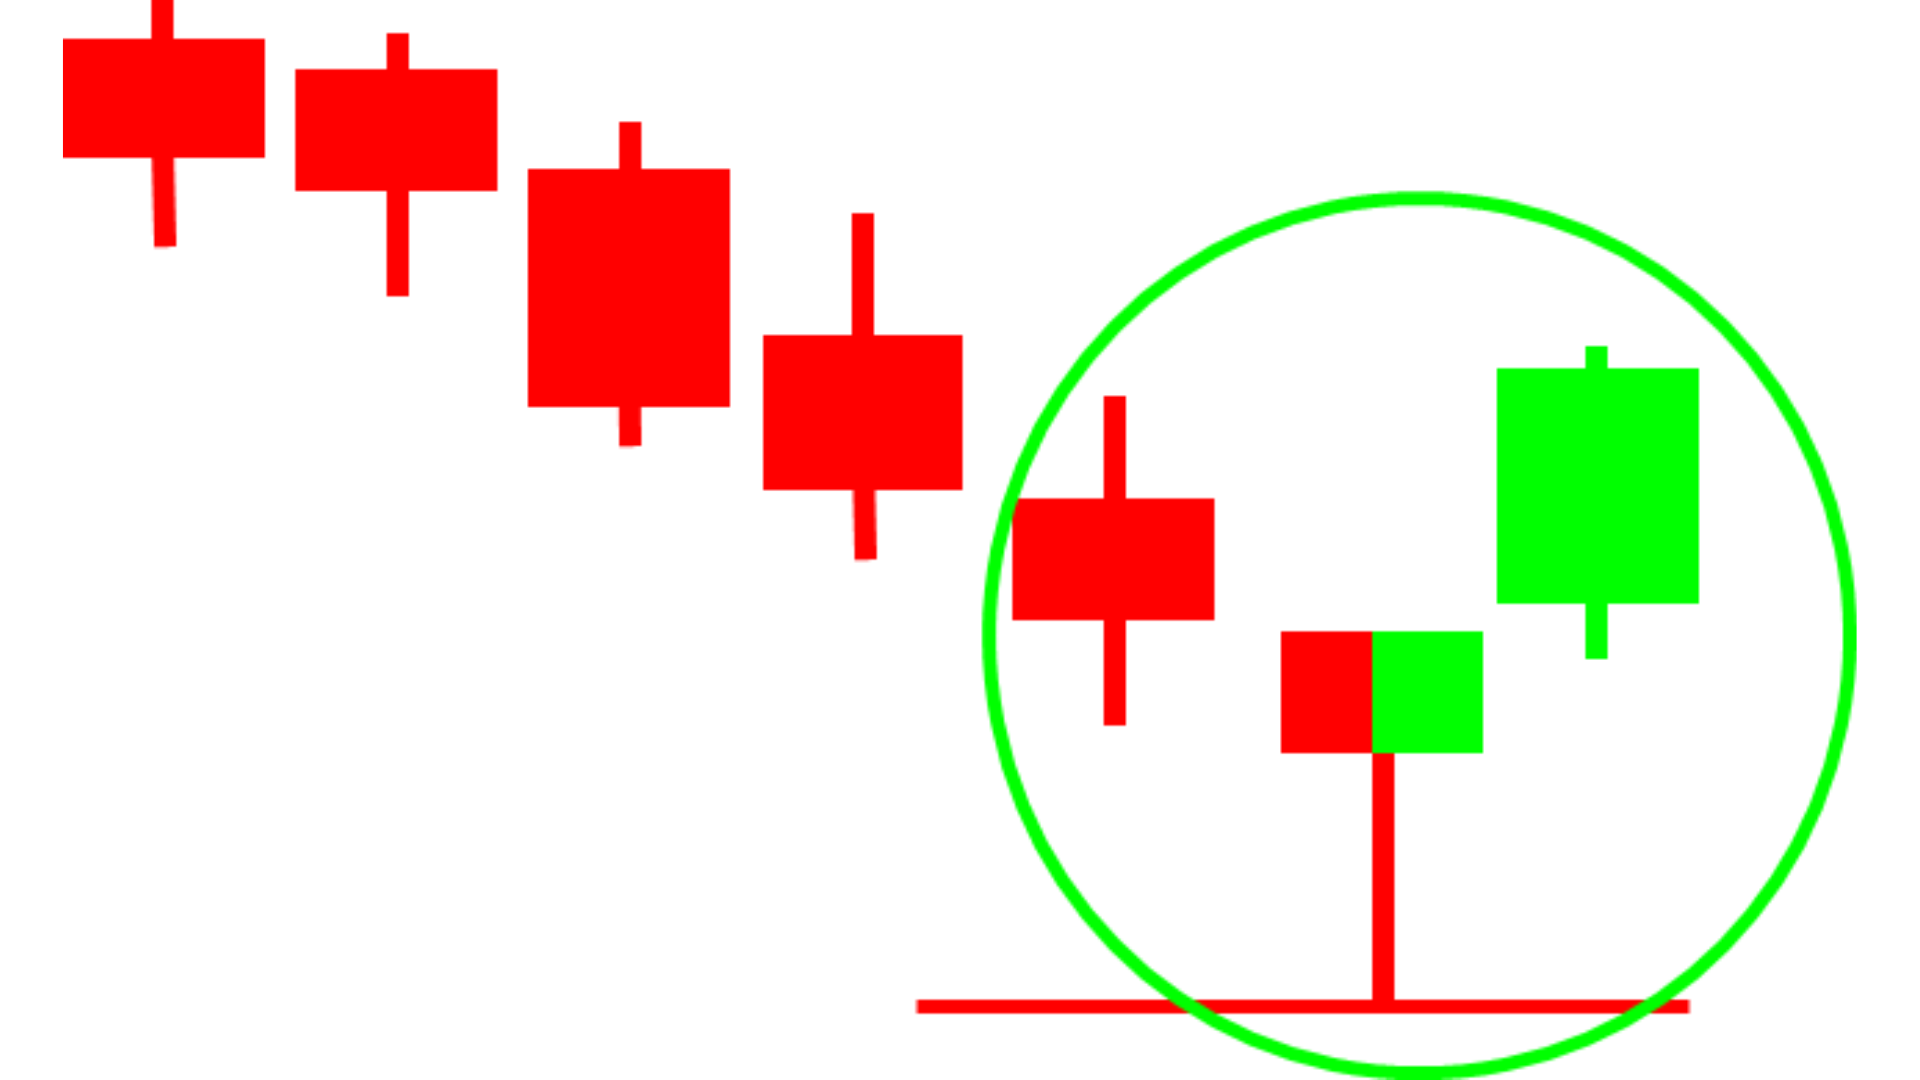
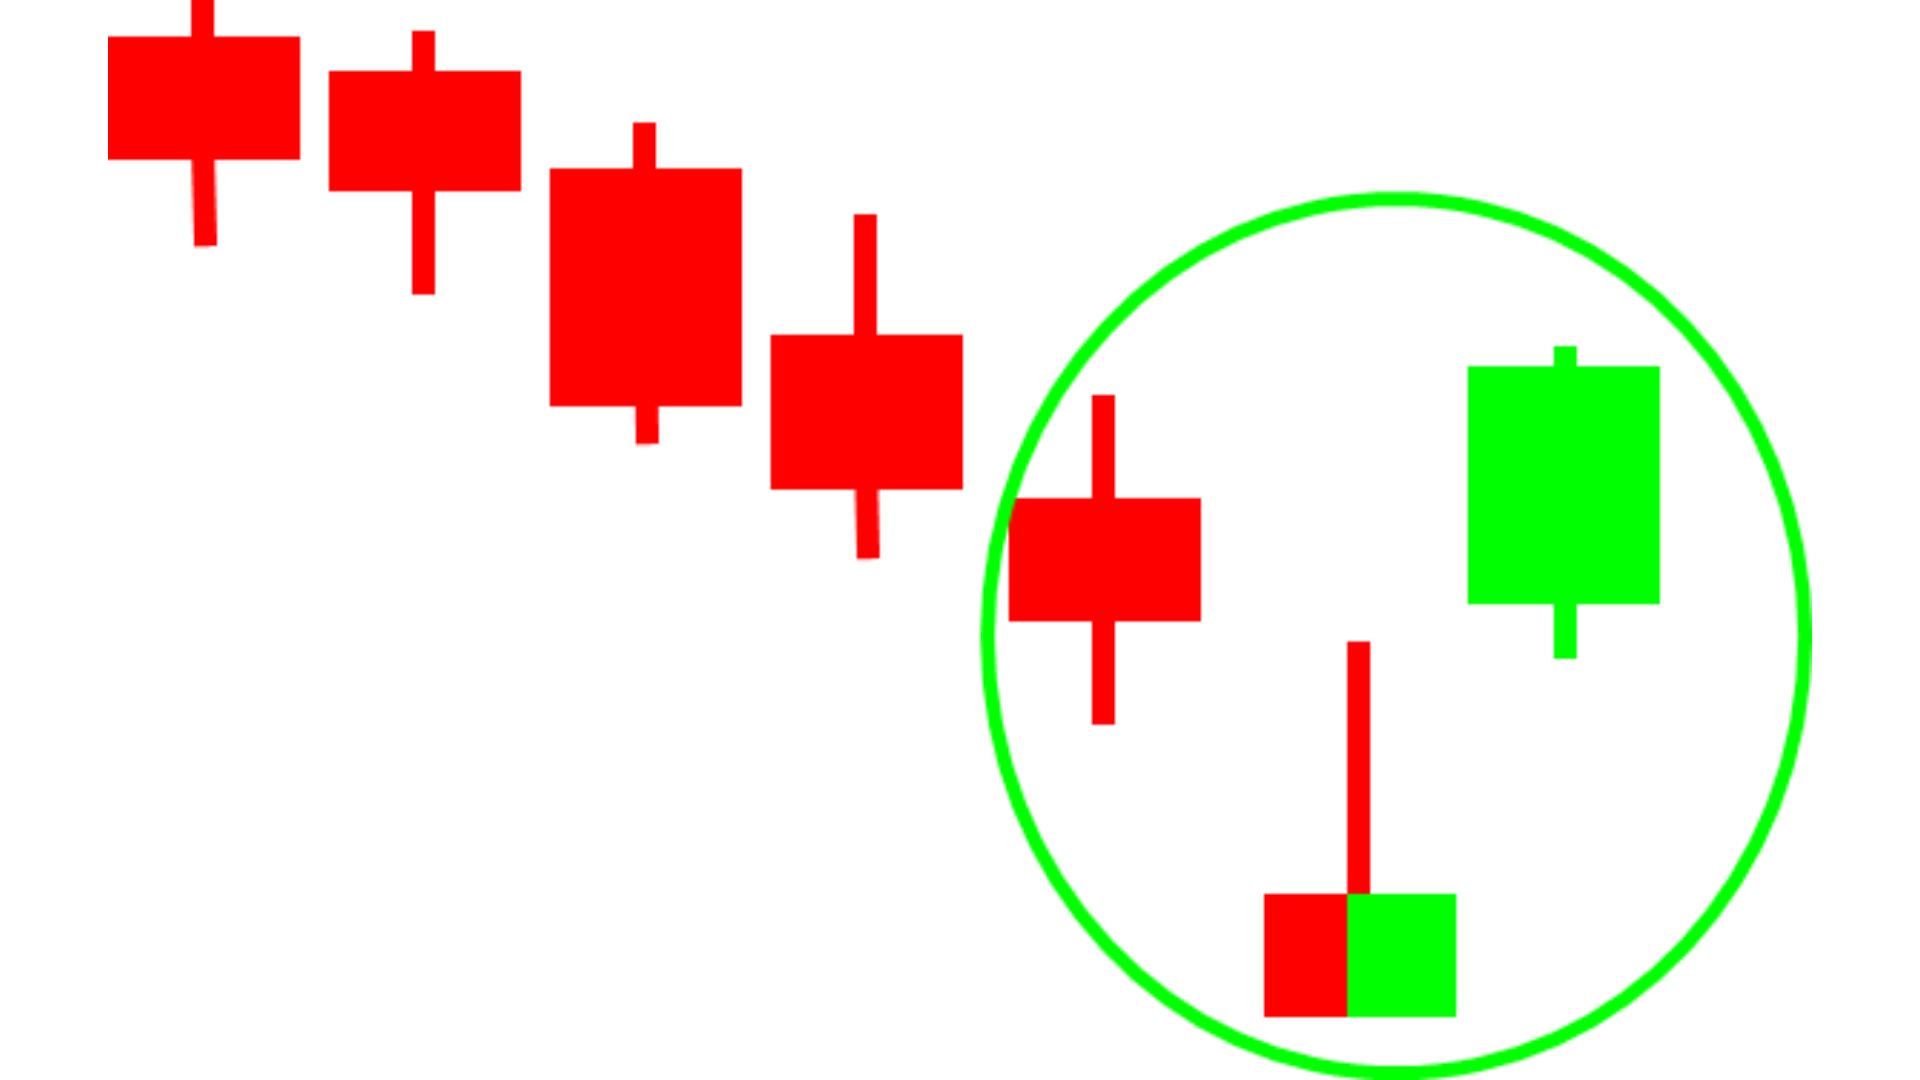
Morning Star
It is comprised of a tall red real body followed by a small real body which gaps down (these two lines comprise a basic star pattern). The third day is a green real body that moves well within the first session red real body.
An ideal morning star would have a gap before and after the middle line’s real body.
Morning Doji Star
It is composed of a long red candlestick followed by a Doji, which characteristically gaps down to form a Doji Star. Then we have a third green candlestick whose closing is well into the first session’s red real body.
An ideal Bullish Morning Doji Star pattern must have a gap before and after the middle line’s real body.
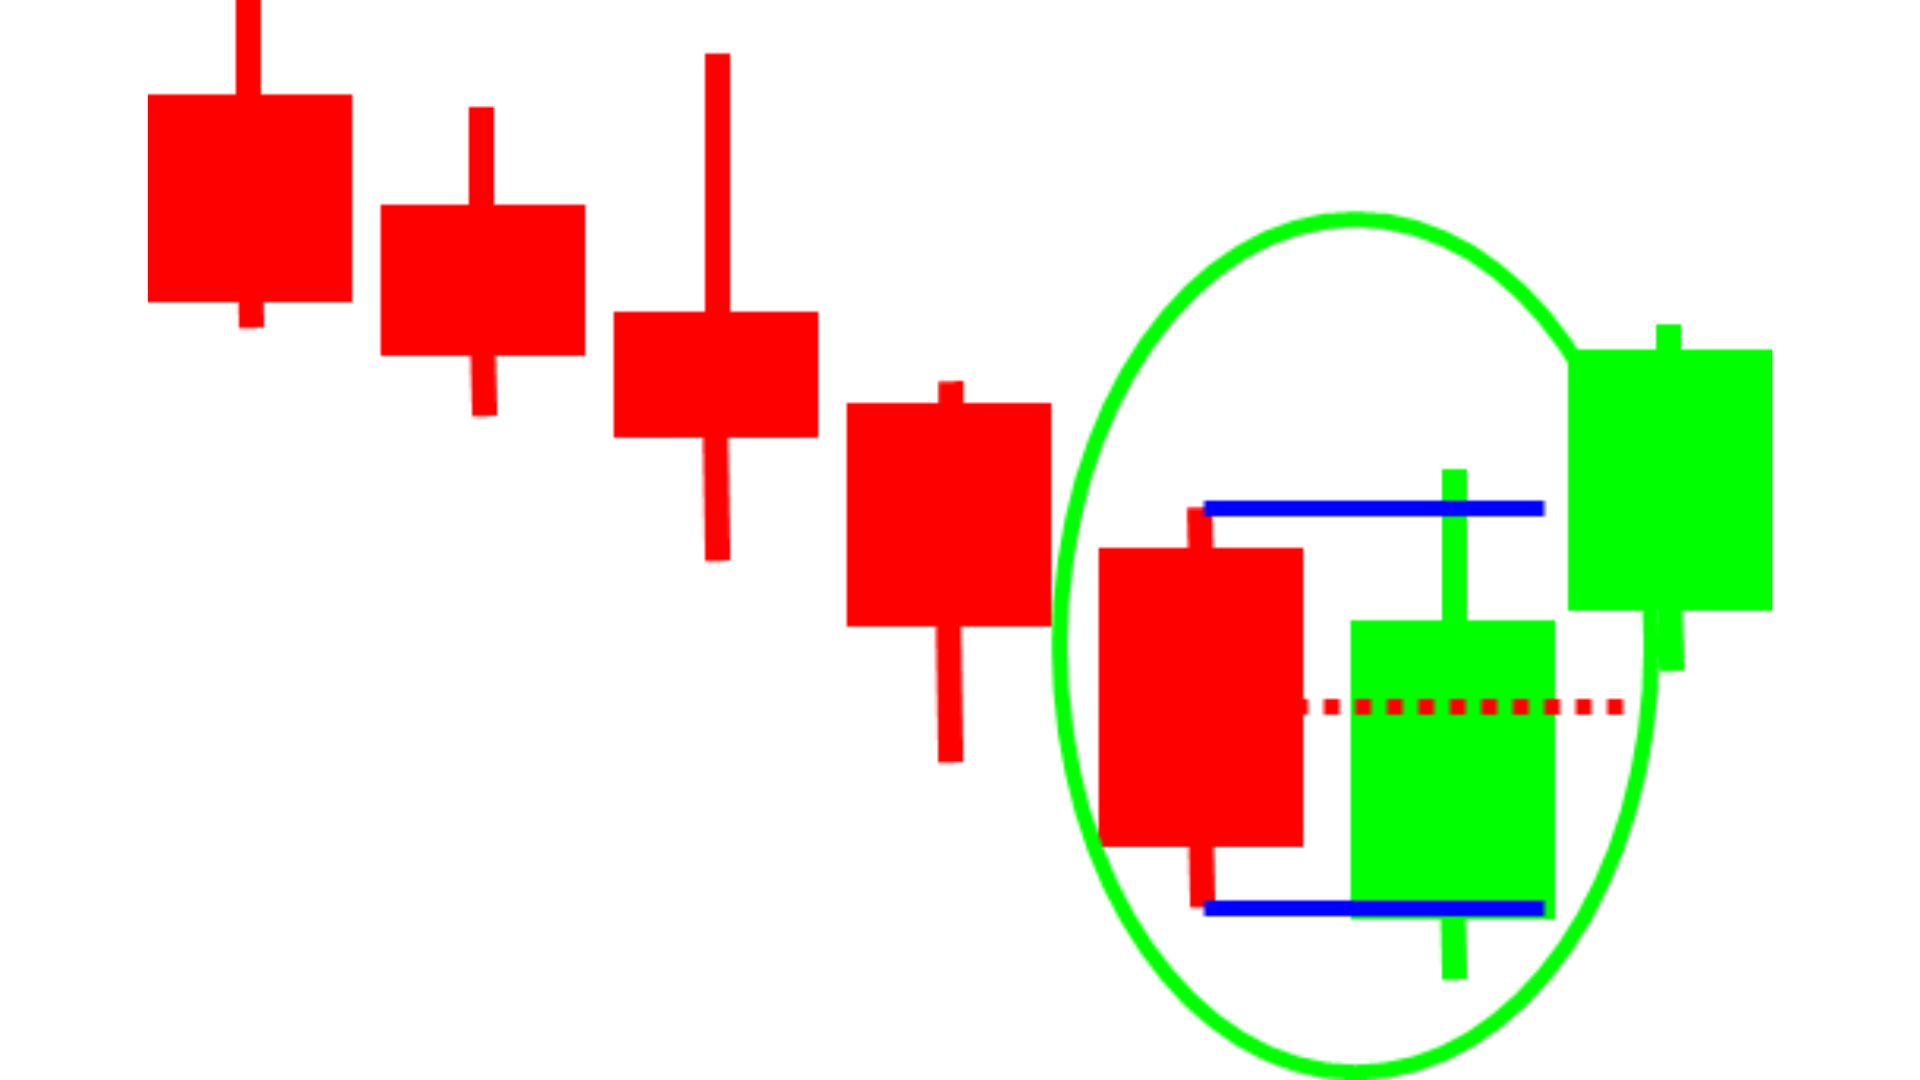
Evening Doji Star
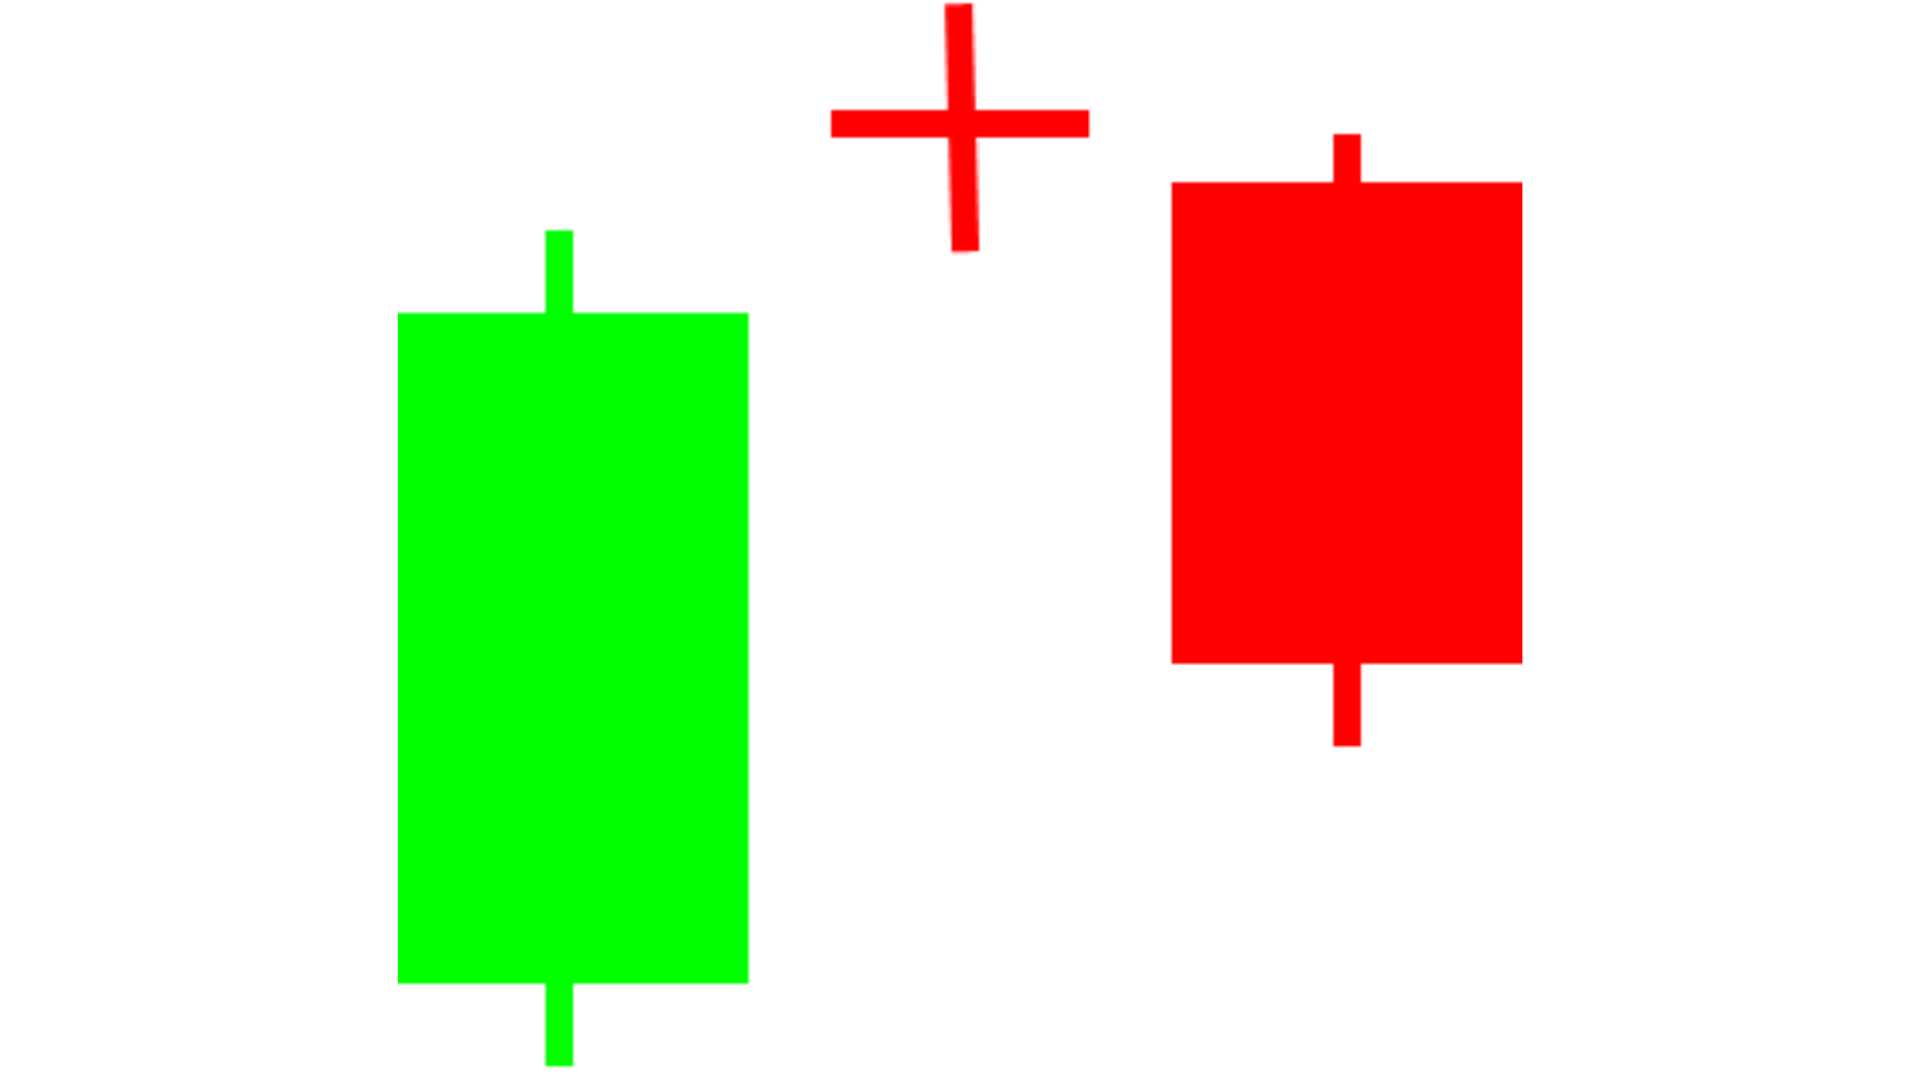
The first candlestick is a long green body, the second is a Doji characterized by a higher gap thus forming a Doji Star. The third one is a red candlestick with a closing price, which is within the first day’s green real body.
An ideal Bearish Evening Doji Star Pattern has a gap before and after the middle real body. The second gap is rare, but lack of it does not take away from the power of this formation.
Shooting star
A shooting star is a two-line pattern that sends a warning of an impending top. It is usually not a major reversal signal as is the evening star, so it needs a followup candle for confirmation of reversal in trend.
Doji
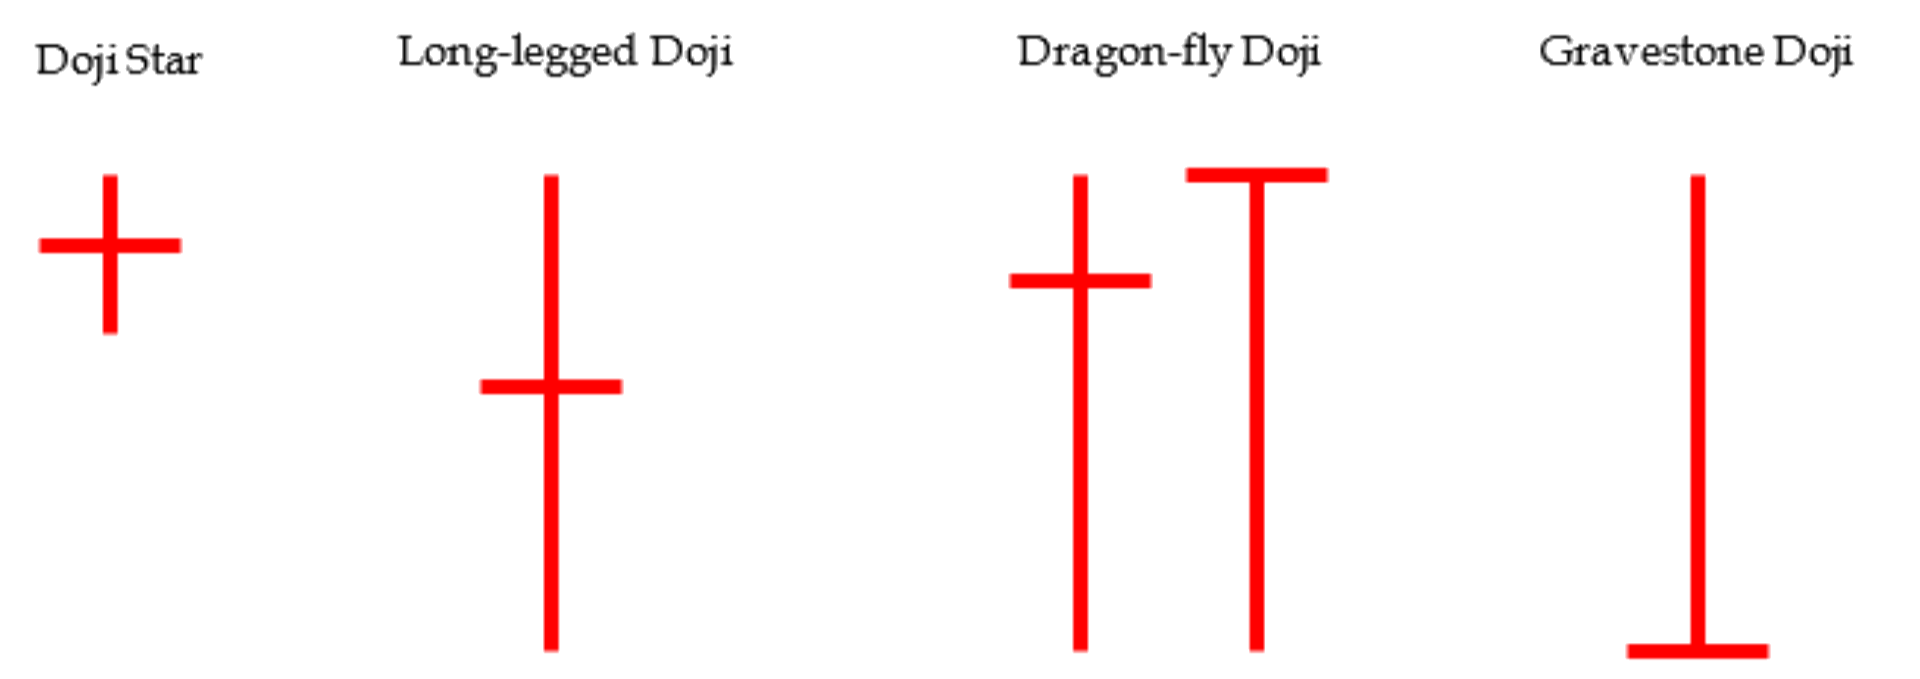
Doji are important candlesticks that provide information on their own and as components of in a number of important patterns. Doji form when a security's open and close are virtually equal. The length of the upper and lower shadows can vary and the resulting candlestick looks like a cross, inverted cross or plus sign. Alone, doji are neutral patterns. Any bullish or bearish bias is based on preceding price action and future confirmation.
It is noted that a doji that forms among other candlesticks with small real bodies would not be considered important. However, a doji that forms among candlesticks with long real bodies would be deemed significant.
A doji with an equal open and close would be considered more robust.
Doji convey a sense of indecision, hence it requires confirmation from the next candlestick.
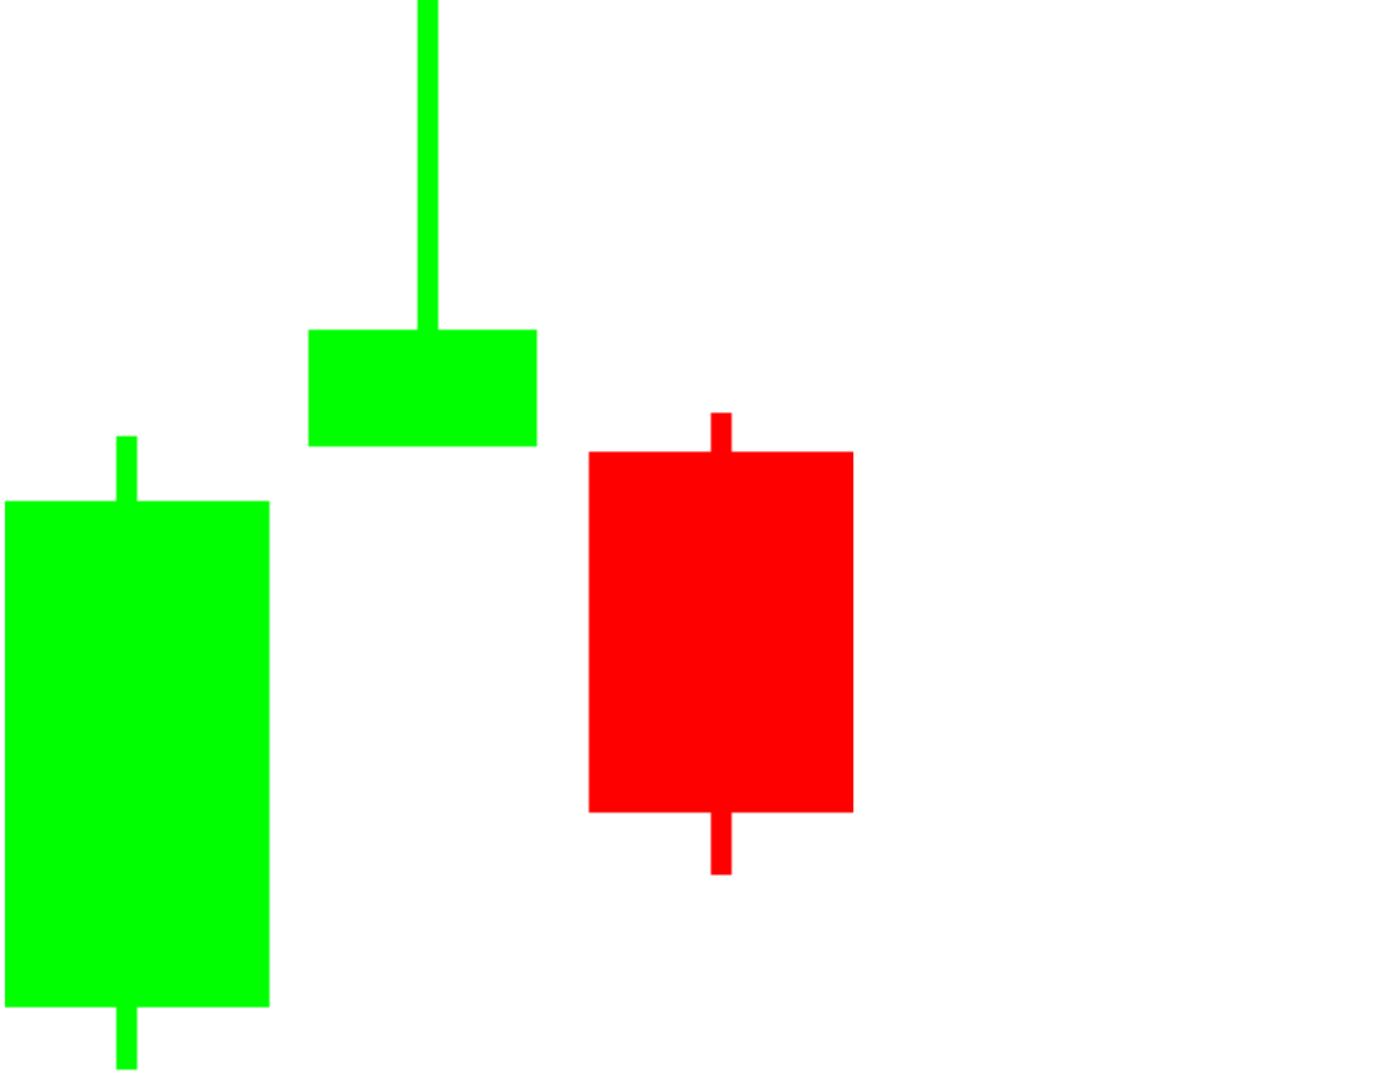
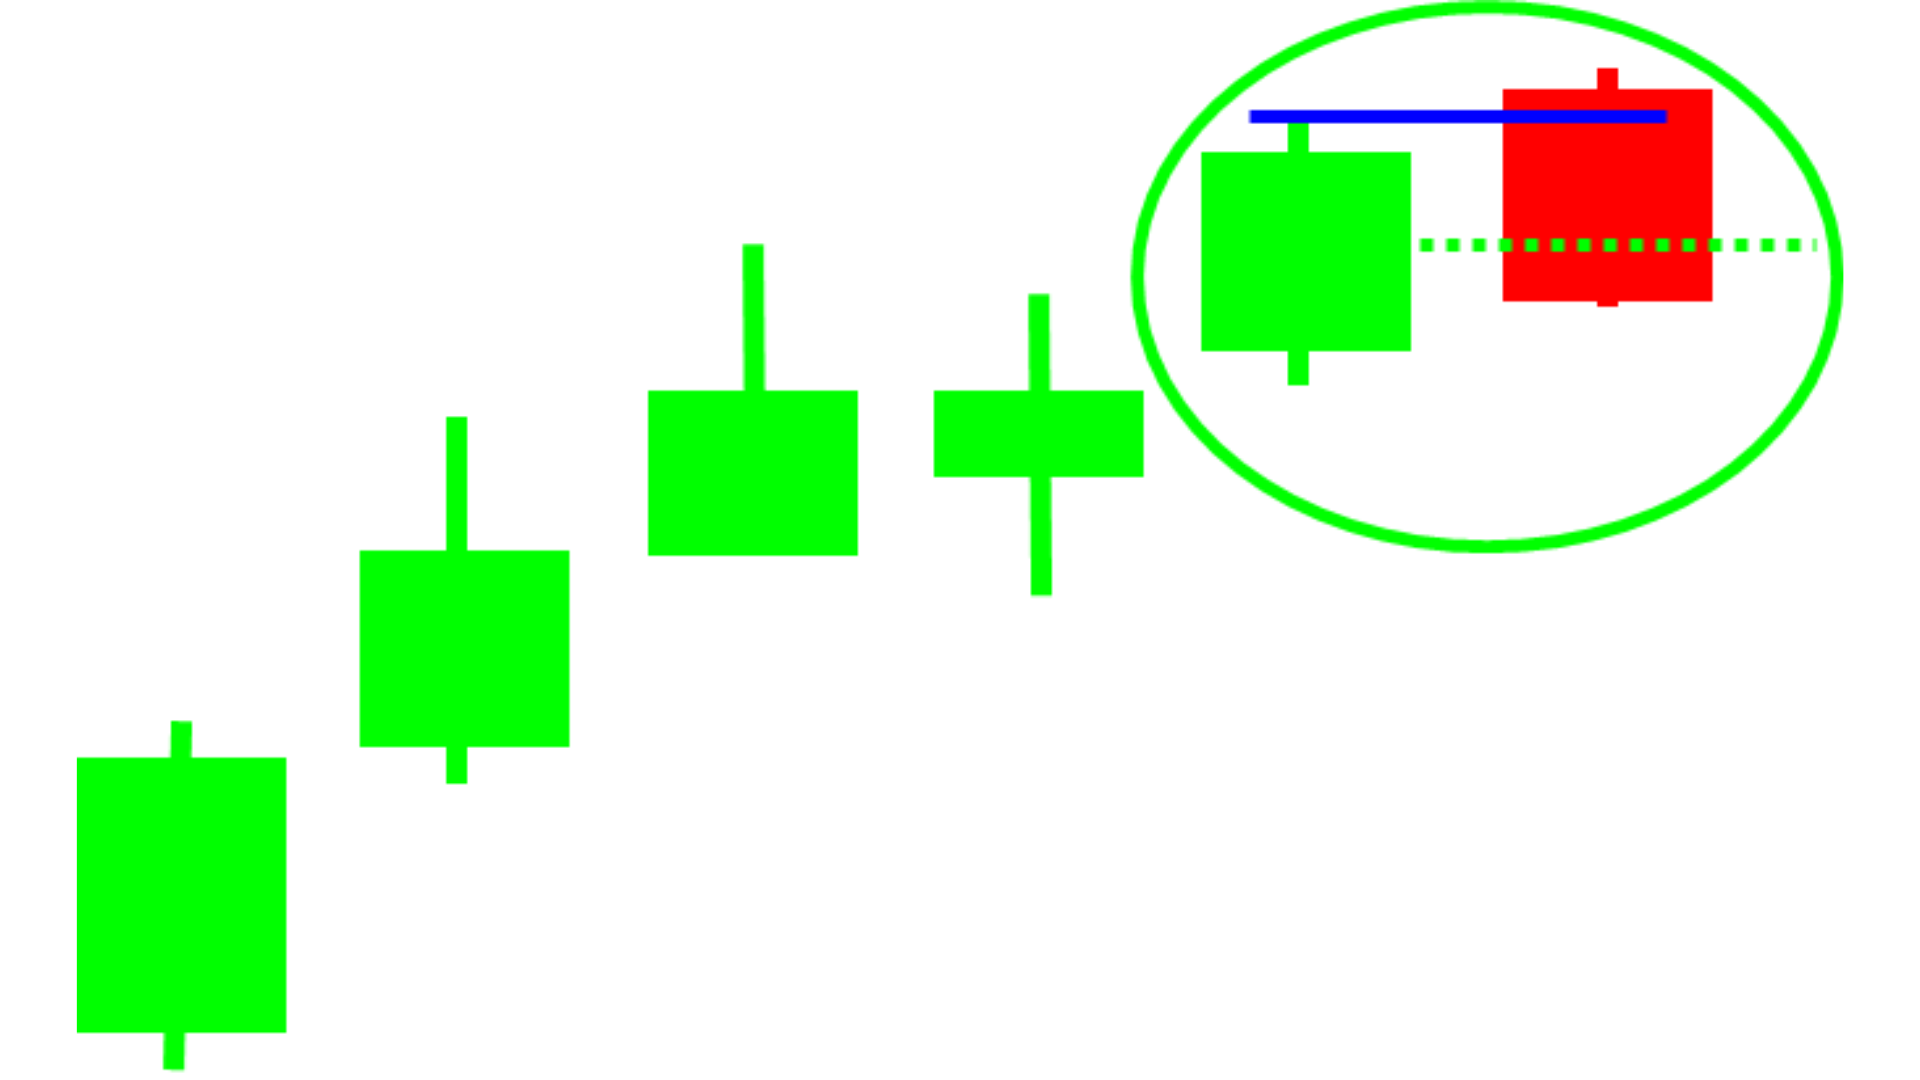
Doji Star pattern
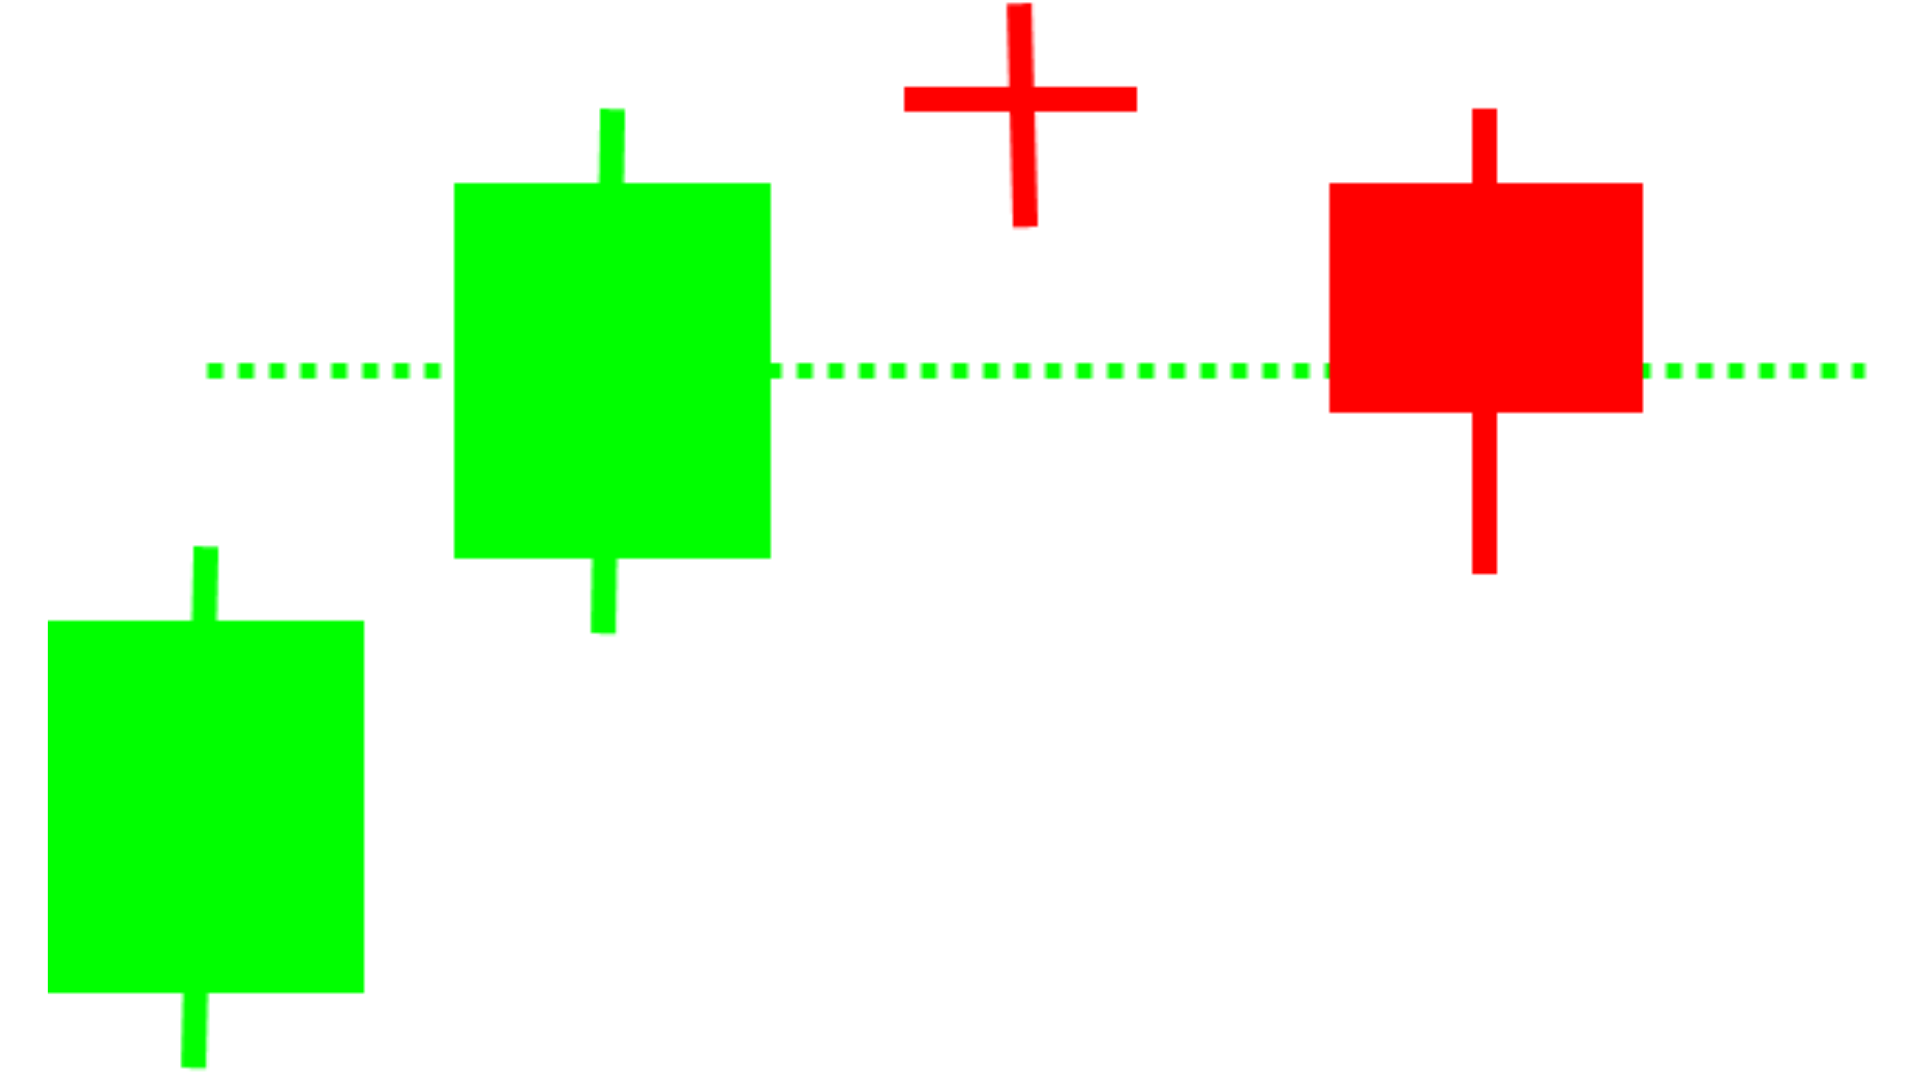
The first candle is a tall green one. Following that, a Doji appears whose body is above the green candle’s body, leaving a gap between the bodies but not necessarily the shadows. A day later, another gap sends price lower into a red candle. Again, the bodies cannot overlap but the shadows can.
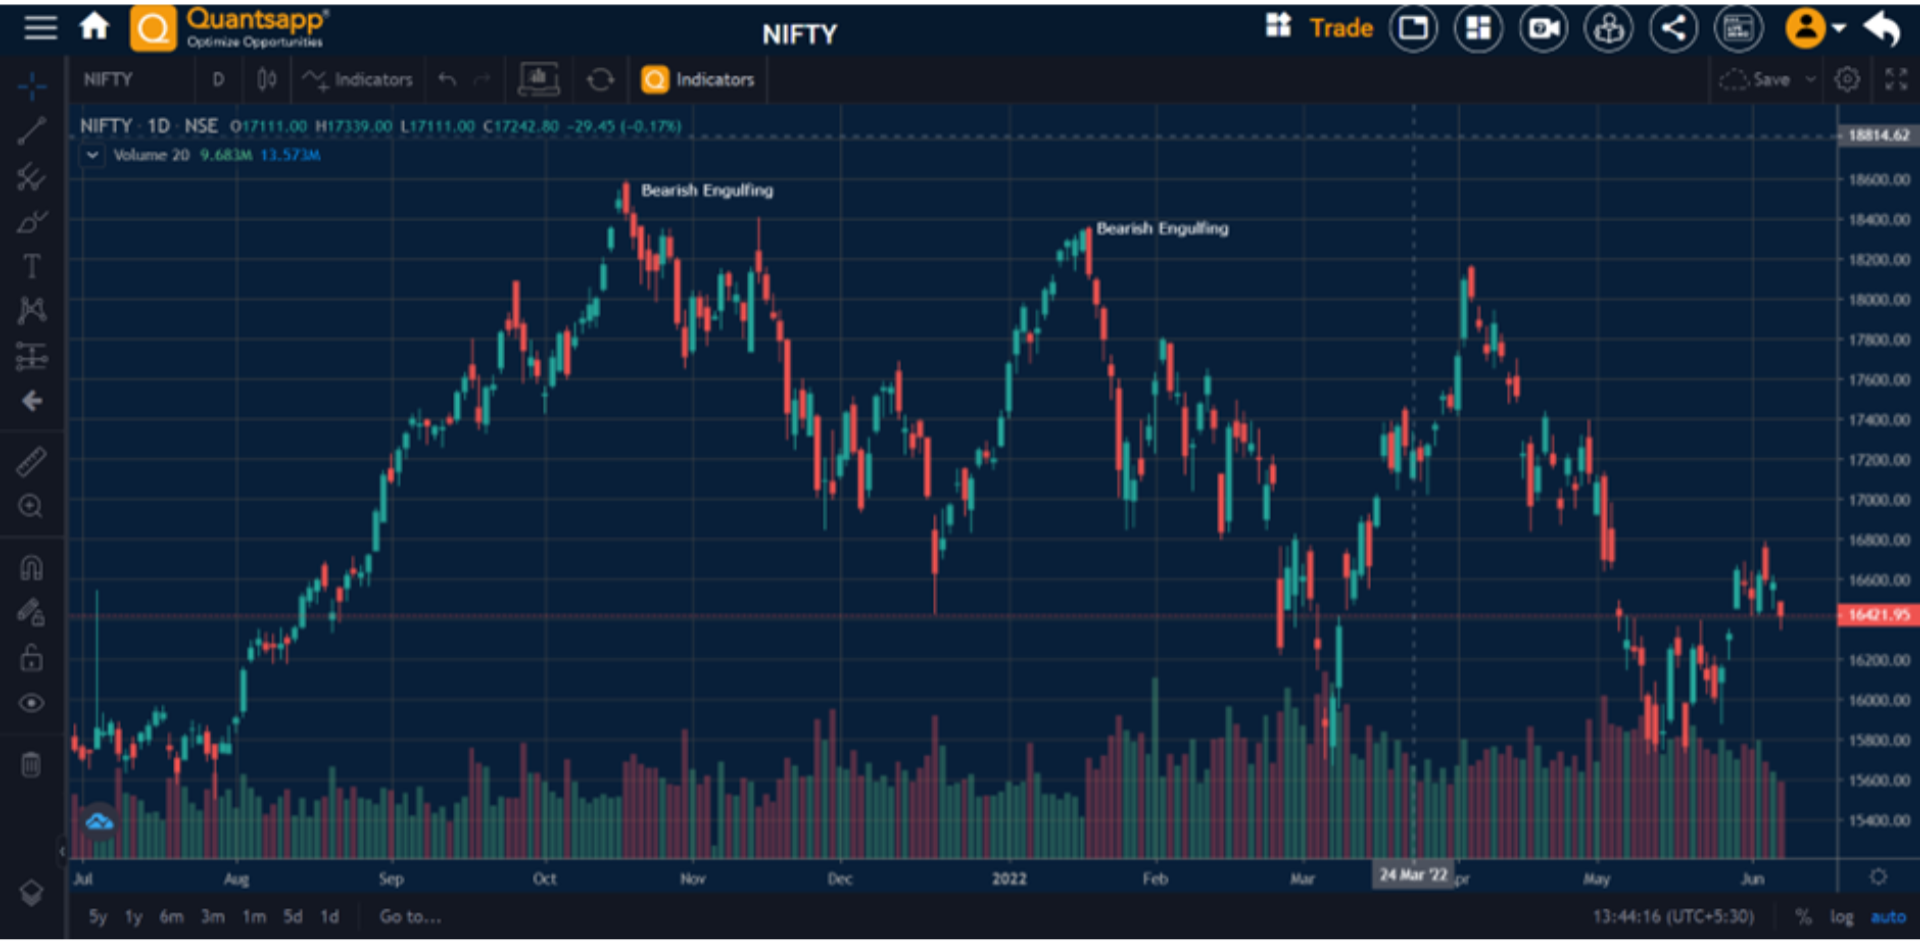
Bearish Engulfing
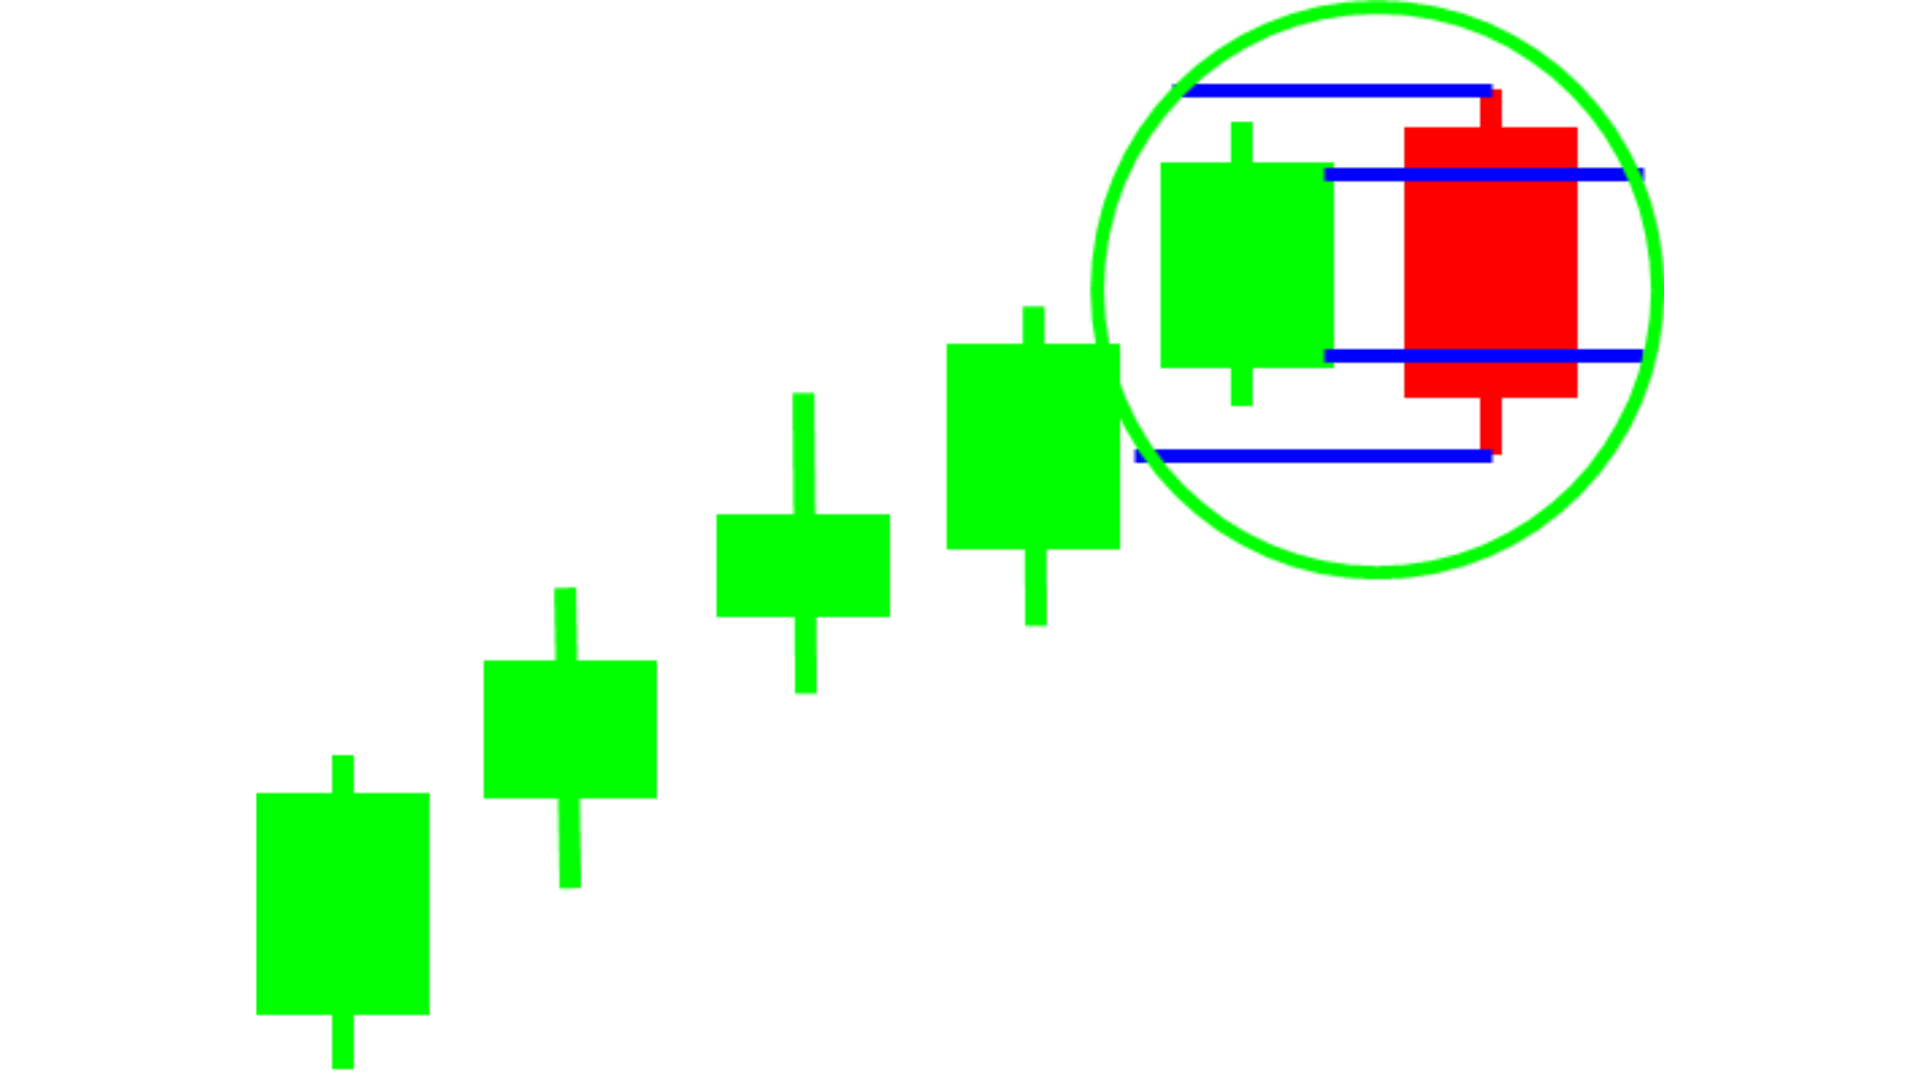
The aforementioned pattern occurs in an uptrend, usually suggestive of end of this trend. Better results are observed when the open price of the engulfing bear candle is well above the close of the first candle, and when the close of the engulfing candle is well below the open of the first candle, clearly overpowering the bullish fervour which existed.

Nifty chart showing bearish engulfing candles and a trend reversal post, formation of the requisite pattern.
Bearish Engulfing
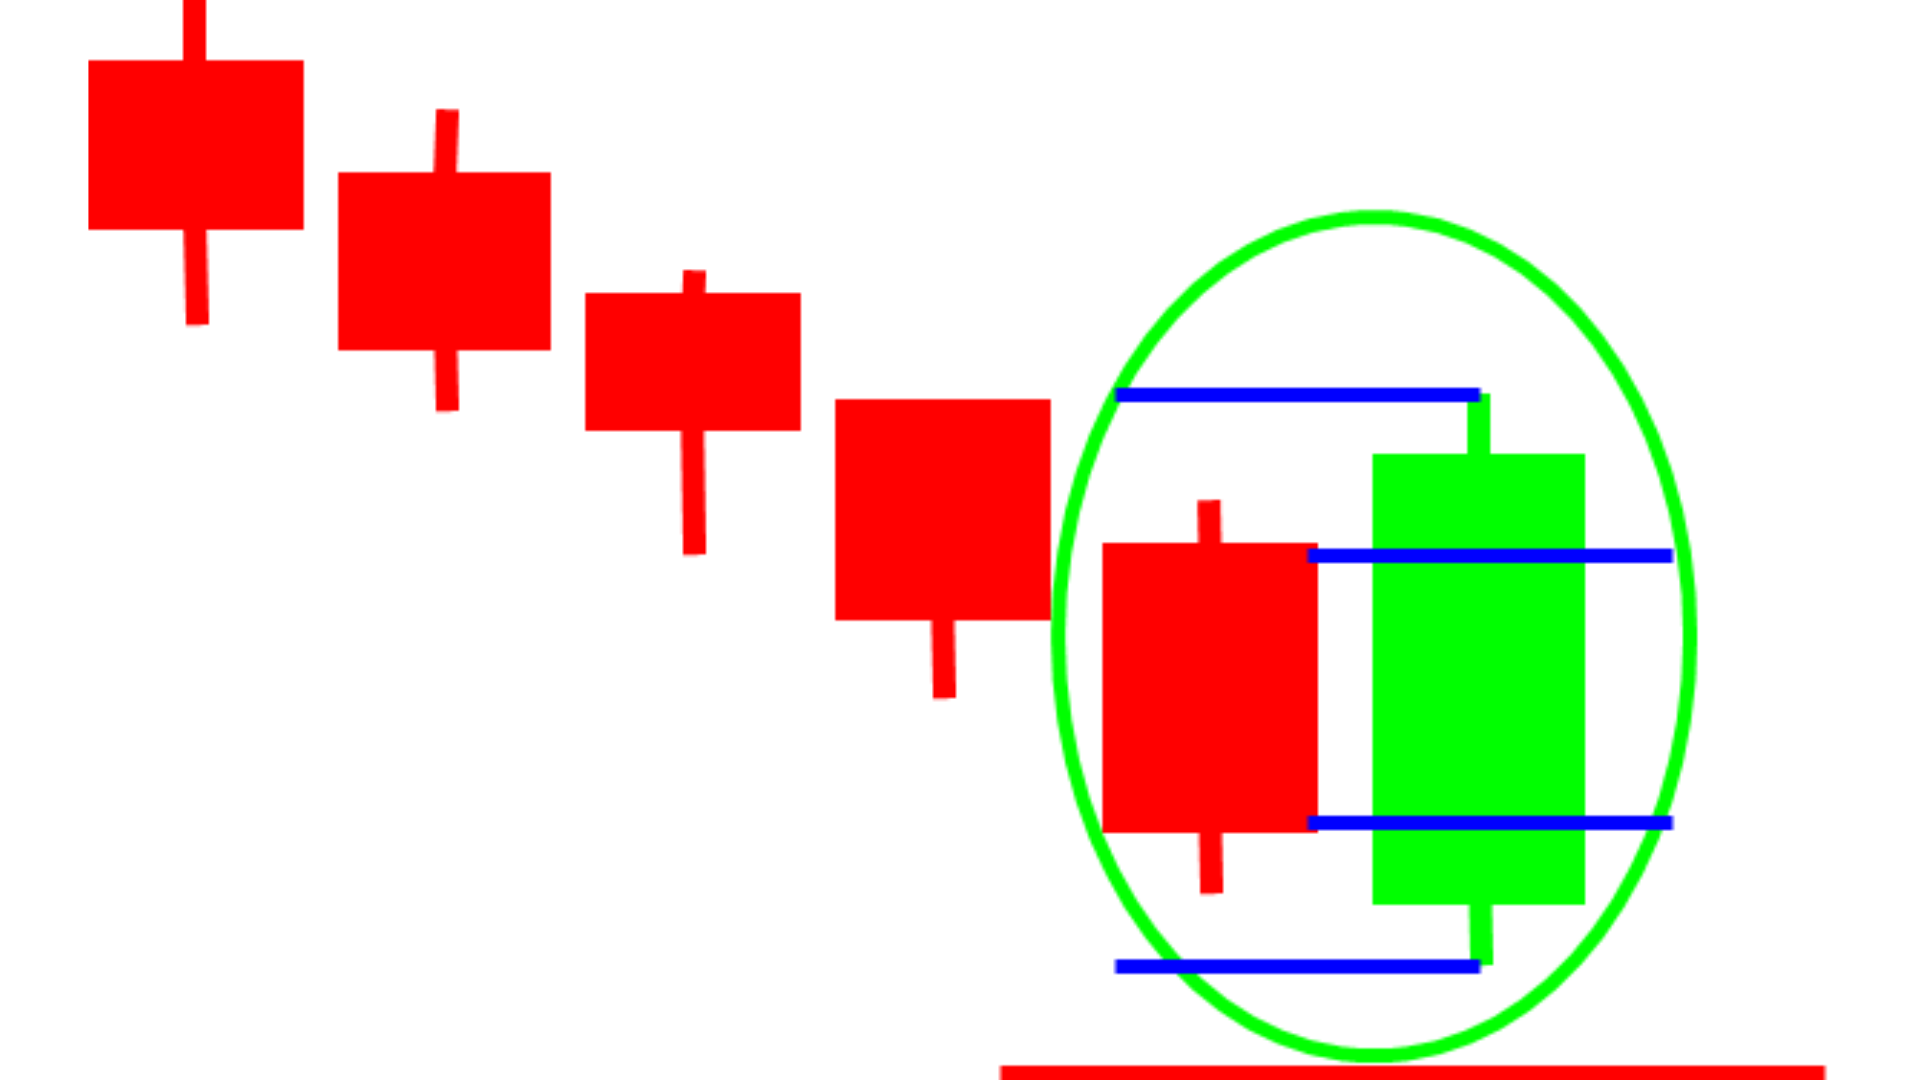
Bullish engulfing pattern appears in a bear trend where, the opening price is lower than the low price of previous candle, while the closing price of current candle is above the previous high price, as shown in the associated illustration. The bull candle engulfs the prior bear candle, hence the name Bullish Engulfing.
Bullish Piercing
It’s a candlestick pattern that includes a gap down open, where the second day begins trading, opening near the low and closing near the high. The close should also be a candlestick that covers at least half of the upward length of the previous day's bearish candle stick body. Hence, it is piercing through half way and possibly signalling that bulls are back.
Dark Cloud Cover
Dark Cloud Cover is a bearish reversal candlestick pattern where a bear candle opens above the closing price of the prior up bull candle and then closes below the midpoint of the prior bull candle.
The pattern is significant as it exhibits a shift in the momentum from the bulls to the bears. Traders tend to seek confirmation, if the next candle is also bearish or not.
Godrej Consumer Products chart shows Dark cloud cover near the intermittent tops and slippage in prices thereafter. Also, shows tweezer bottom and doji candle stick, shown.
Hammer
Hammer candlestick pattern typically occurs after a decline. The hammer like structure occurs, as shown in the illustration, when a security trades sharply lower than its opening, but rallies within the period to close near the opening price. The colour of the hammer isn’t important, but the positioning and the confirmation from the following candle is crucial. Note: the lower shadow is at least twice the size of the real body, in case of an effective pattern.
Inverted Hammer
On the chart, since the candle looks like a hammer turned upside down; hence the name inverted hammer. The colour of this candle body doesn’t matter. The prices open high, but end lower close to the opening price. If the close below the open, then the inverted hammer would be red in colour, otherwise green. It suggests or augurs for a bullish reversal, but the confirmation of the same comes from the third candle as shown in the illustration above.
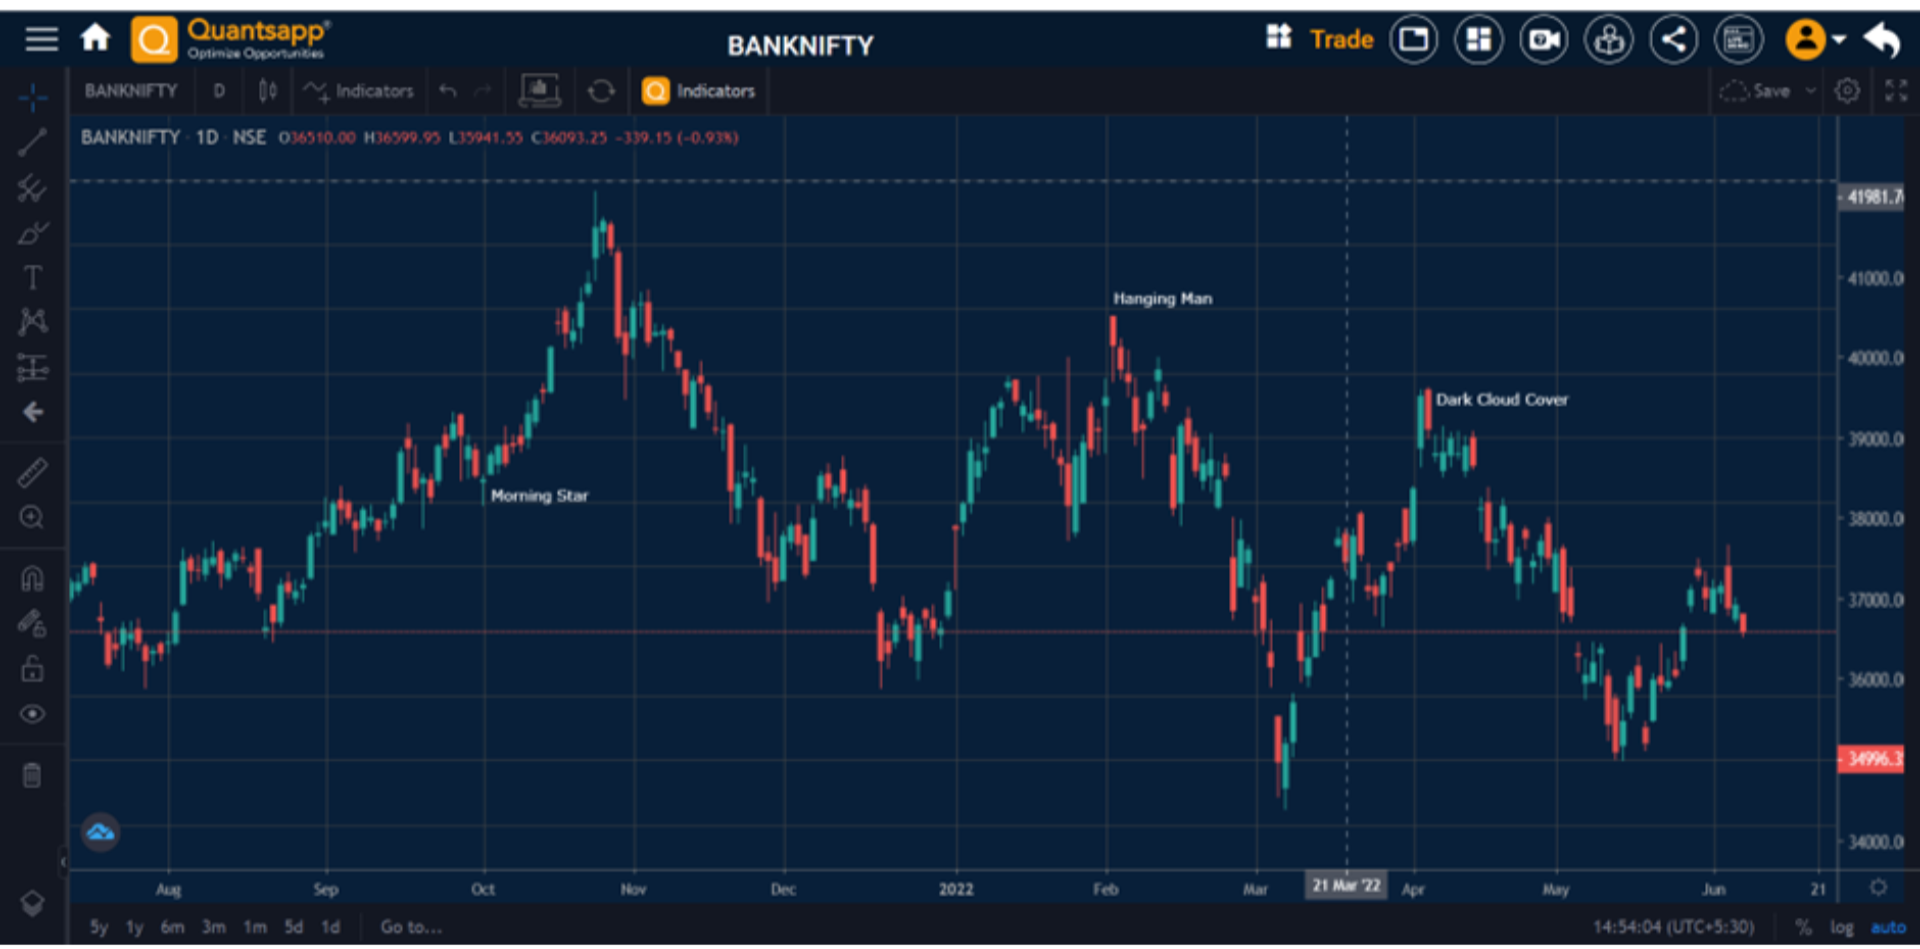
A variety of candle stick patterns visible on BankNifty chart on Quantsapp.
These candlesticks patterns help in forecasting trends in the underlying and hence help in strategizing option trades appropriately.
As, its about price which captures sentiment, the next chapter would focus on trend analysis using price, doing it the western way!
FAQs
What is a candlestick pattern?
Candlestick charts are a technical tool that packs data for multiple time frames into single price candles, open, high, low, close (OHLC) bars. So, for a daily chart, one candlestick represents the activity of a single day. Sometimes a few candlesticks (may be 2, 3, 4, or more), called multi-candle stick patterns, that may predict price direction once completed.
How do you read candlestick patterns for beginners?
A single candlestick indicates the opening and closing price, which represent the body and the high price of the period (1 day, if daily charts), is indicated by a wick on the upper side and low price of the time period is indicated by the bottom of the wick on the lower side.
The behaviour of prices over the period of 1 day i.e. in case of a daily chart is encapsulated in terms of its shape and colour to represent the sentiment. So, if a daily candlestick chart for one month, has more consecutive reds, then traders know that the price is falling. Similarly there are known candlestick patterns like hammer, harami, evening star, morning star, doji star etc. which have been backtested and are suggestive of specific directional nuances.
How many types of candlestick patterns are there?
There are over 100 candlestick patterns, hammer, dark cloud cover, doji, morning star, evening star, harami are only a few of the recognised candlestick patterns.
Does candlestick pattern analysis really work?
Yes, this is Japanese technique of reading charts and their embedded sentiment, which is visible through shape of candle and its colour coding. This technical tool, which dates back to 18th century Japanese rice traders has proven to be a useful technique.