The prior chapter was based on OI and Price action charts and their inter-relationships, while now the approach in this chapter is to use strategy charts to gauge appropriate entry and exit points of a given option trading strategy.
Ideas
Ideas
.svg)
Intel Junction
Trade
Trade
Orders API
Watchlist
Orders
Positions
Broker Access
Hot Keys
Alert Trigger Order (ATO)
Bracket Order
Target Stoploss Order
Add Broker
Track
Futures OI
Options OI
News
Price & Volume
Alerts
Built-Up Breadth
Built-Up Scrip Symbol
Synopsis Futures OI
Built-Up Sectors
Top Stocks
Intraday Movers
Analyze
Charts
IV
PCR
Expiry
Price & Volume
Charts/ Order & Trade
Multi Strike OI
O&T Watch List
Strategy Chart
Scan
Hist-Futures
Hist-Options
Pairs
Built-Up Scrip OI-Historical
Built-Up Sector Cycle
Built-Up Sector OI-Historical
Built-Up Scrip Cycle
Comparative Analysis
Tools
Easy Strategy
Strategy Builder
Quant Models
Essential Tools
Optimizer Find Strategy
Optimizer Find Specific
Optimizer My Forecasts
Optimizer Constrains
Learn
Live
Self Learning
Events
Webinars

Book a Session


Chapter 5
Option – Strategy Charts

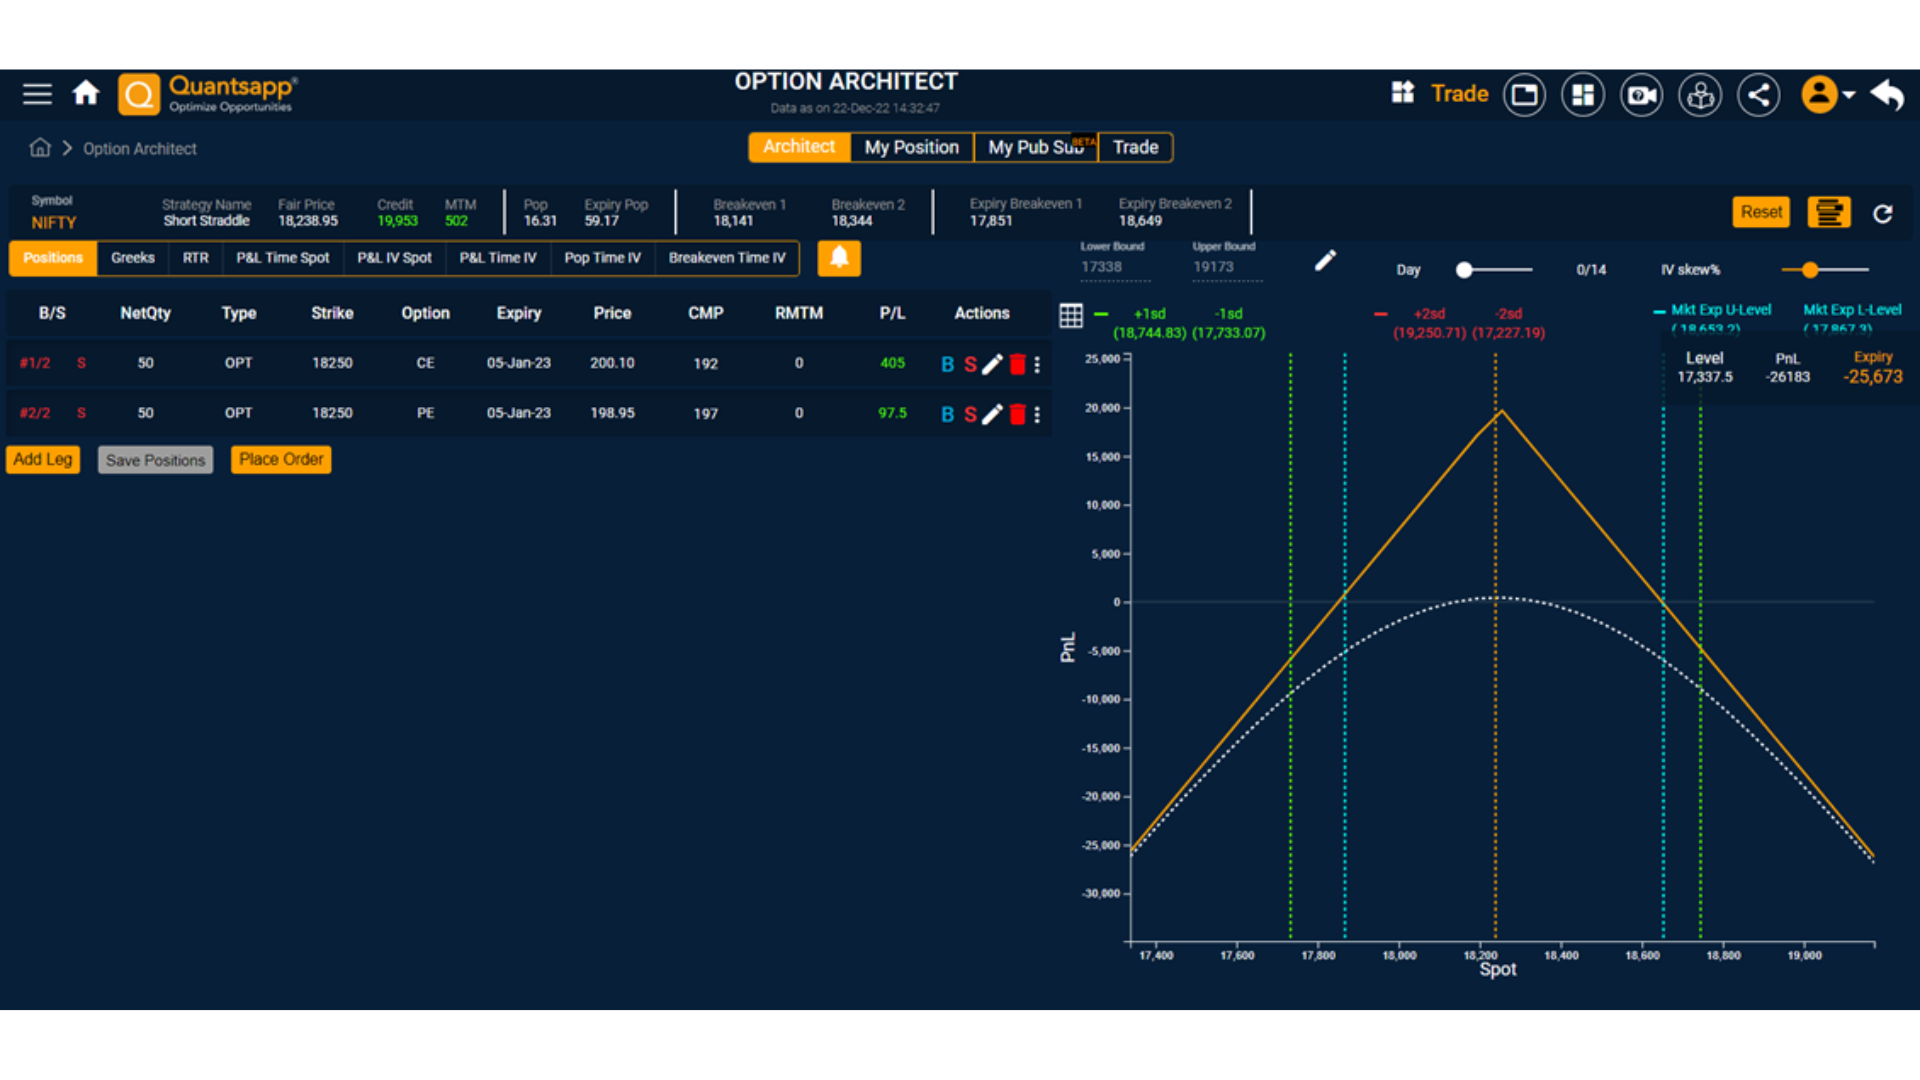
Using Quantsapp option strategy builder, Option Architect, a short straddle strategy on Nifty was created with the following legs:
Sell (1 lot) 18250 CE 5Jan23
Sell (1 lot) 18250 PE 5Jan23
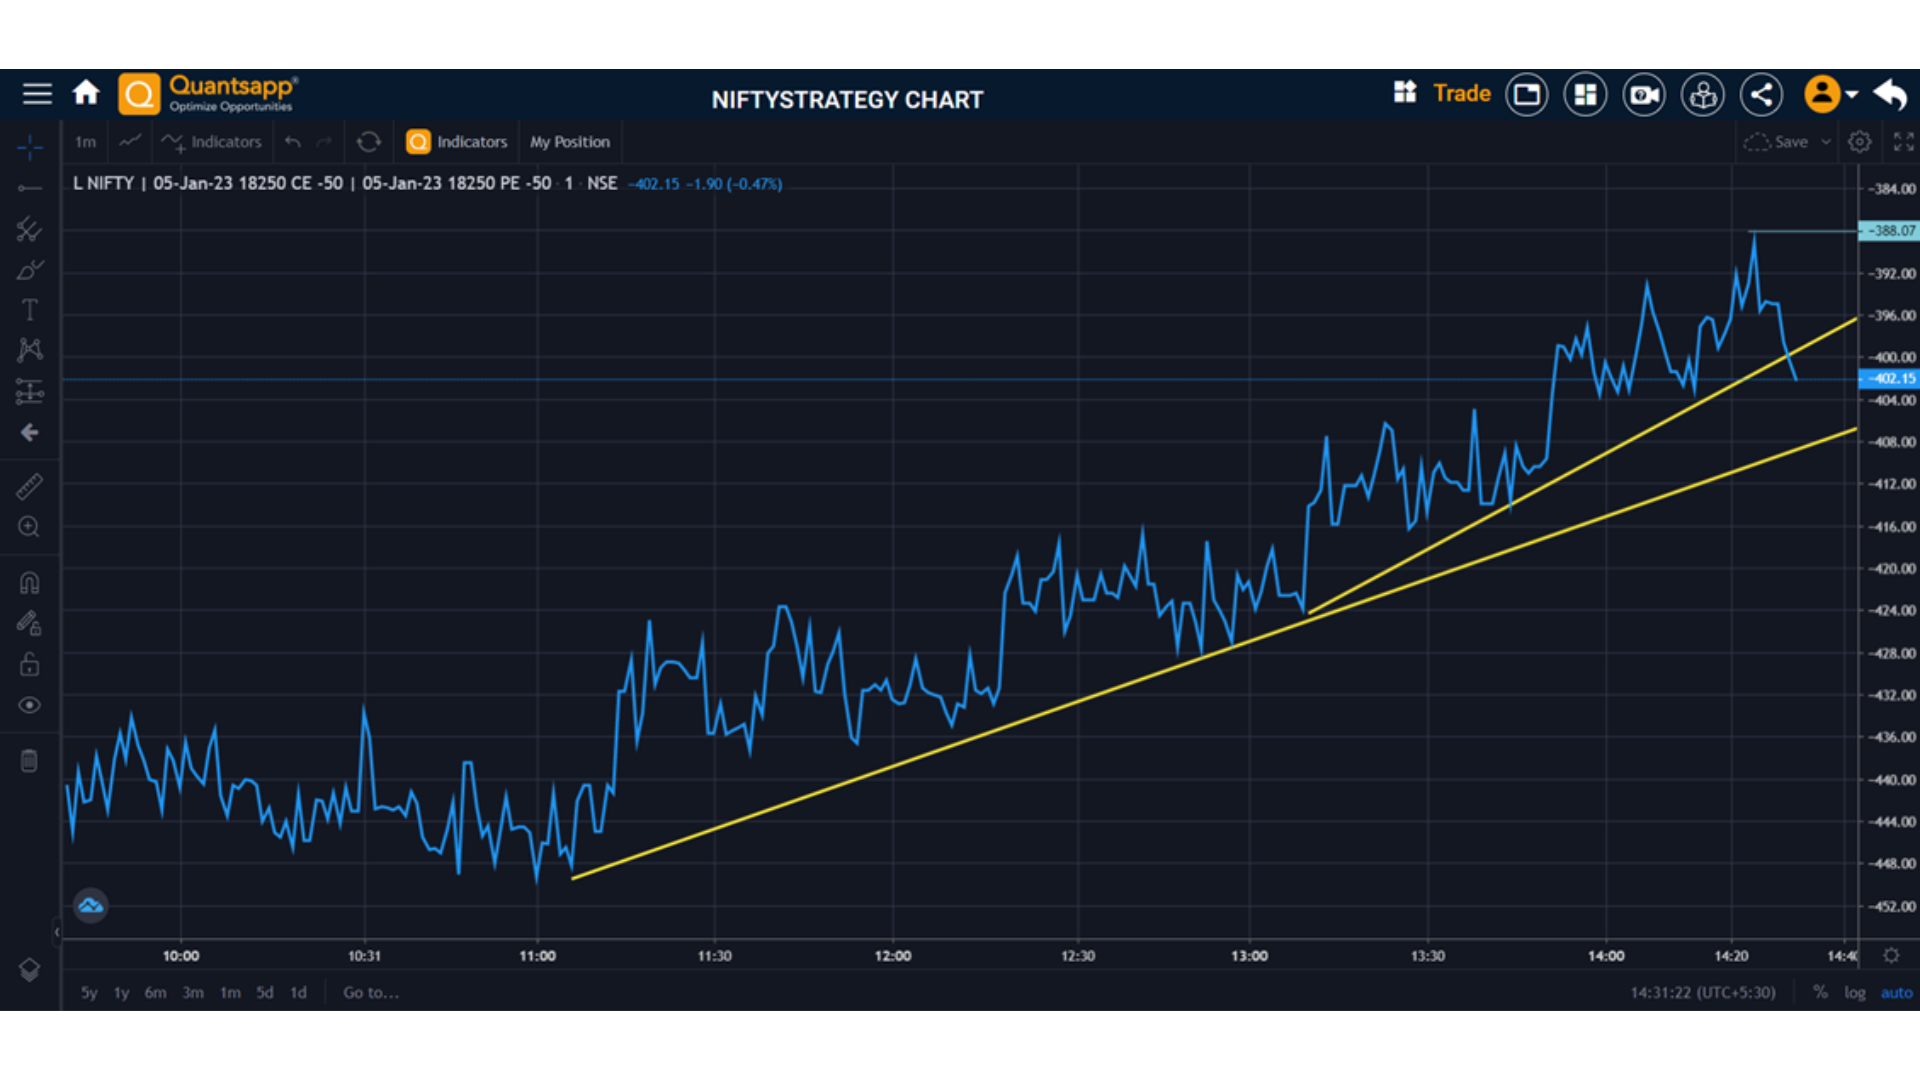
The behaviour of the net option premium is highlighted in the option strategy chart, which is indicated ahead. This is a chart which is intraday and suggests possible trends in the net option premium of the strategy and is a strong enabler in terms of deciding the crucial technical supports and resistances. This is a strong enabler for variety of option trading strategies.
The trend lines drawn on the chart and also critical consolidation levels, help market participants to envisage appropriate entry level and risk level, i.e. Stop Loss level for a given strategy based on the net option premium chart. Also, from the chart, it is possible to state that -388 should act as a temporary resistance for the net premium of strategy. As it’s a short straddle strategy, the premium is stated as negative and when the premium moves closer to 0, implies that the short straddle strategy was fruitful.
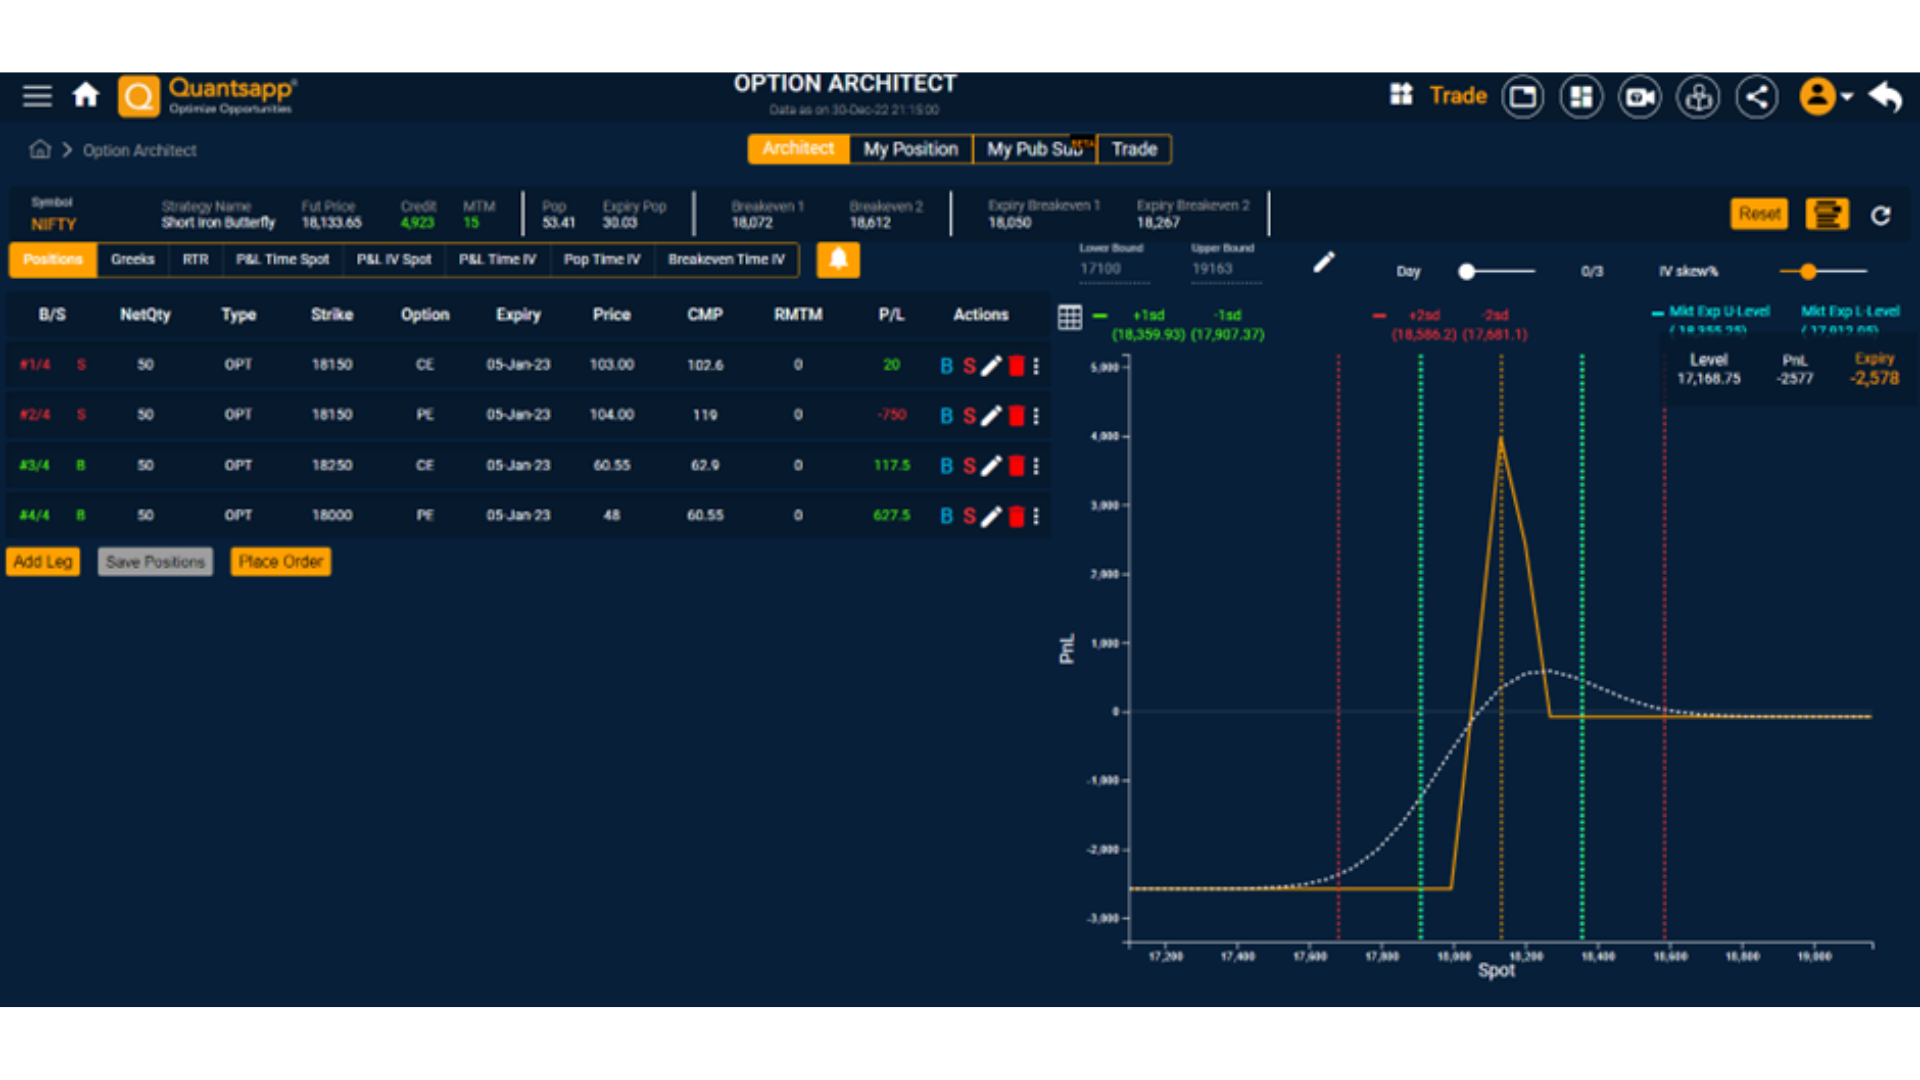
In another example, of Iron Butterfly, the following legs were being considered, as mentioned in the option architect:
Sell (1 lot) 18150 CE 5 Jan 23
Sell (1 lot) 18150 PE 5 Jan 23
Buy (1 lot) 18250 CE 5 Jan 23
Buy (1 lot) 18000 PE 5 Jan 23
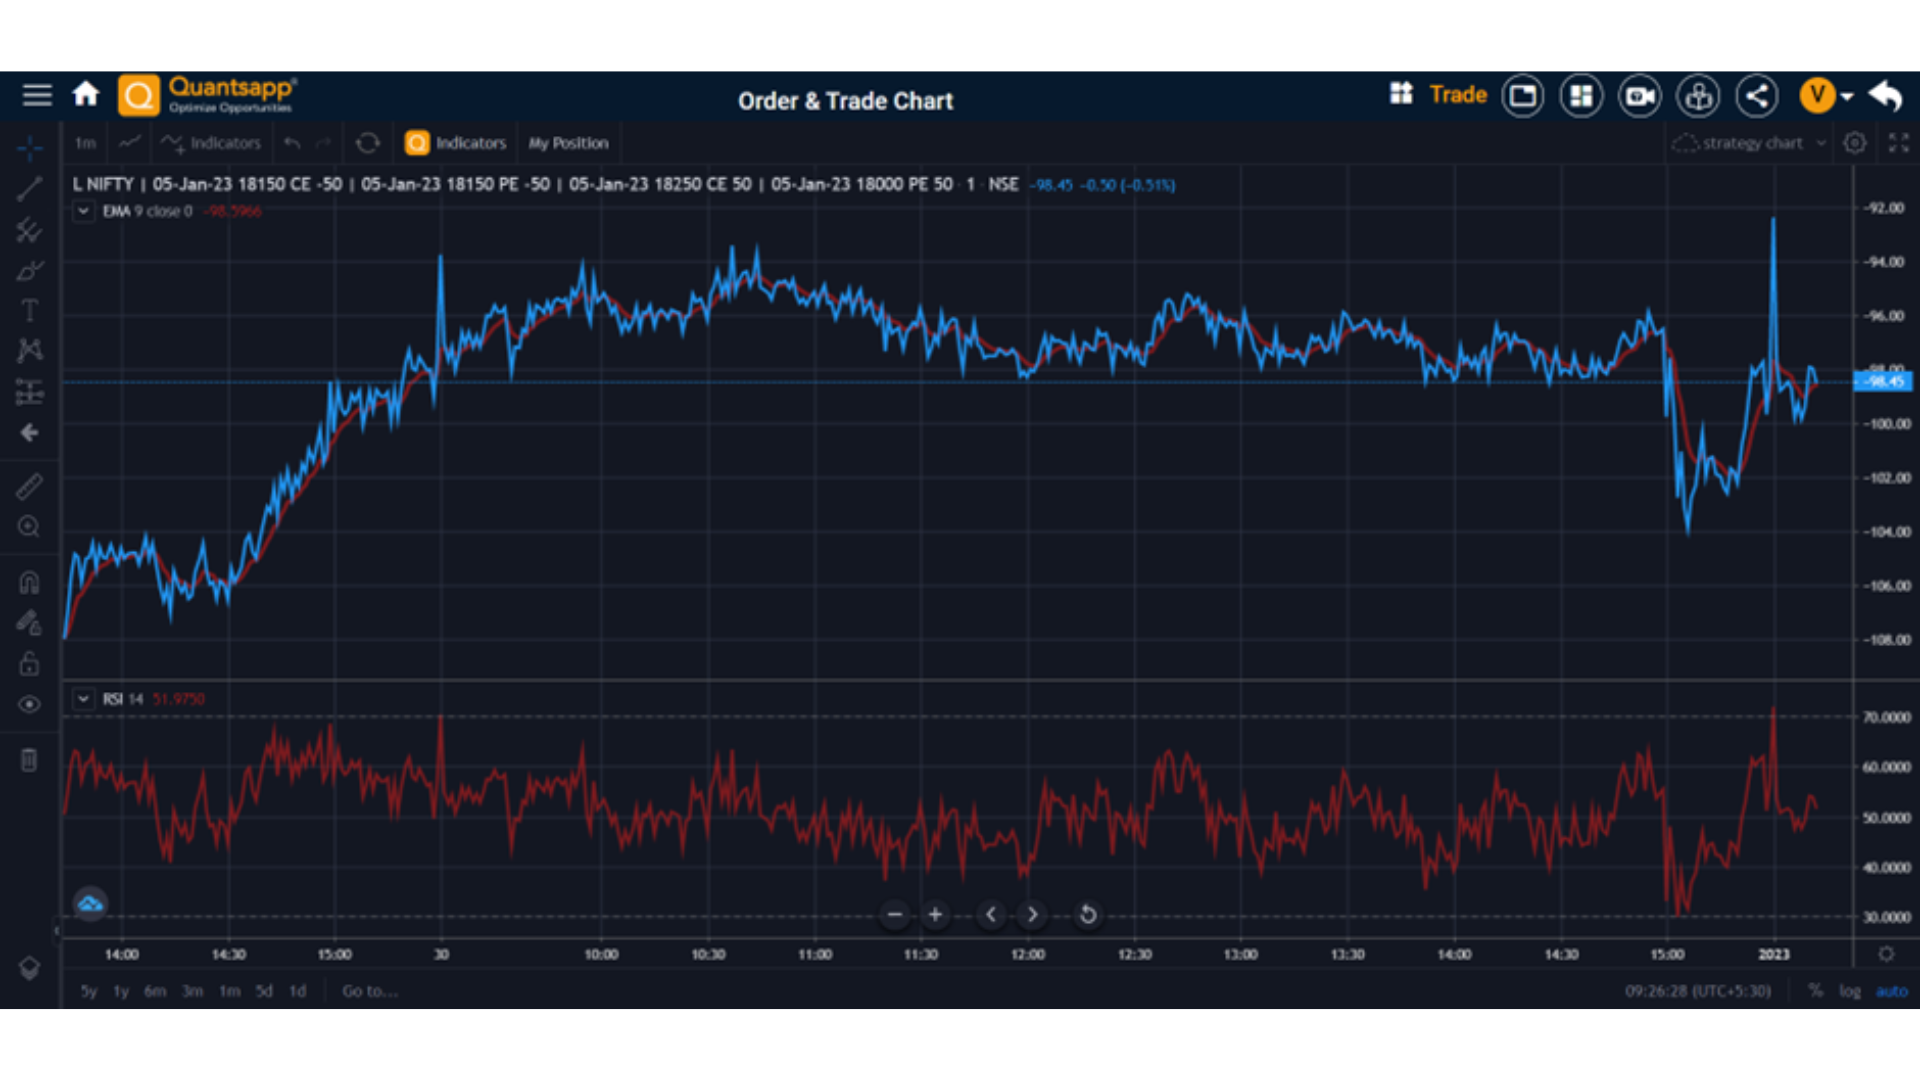
The Nifty Butterfly spread strategy chart involves the study of the overall option trading strategy using option premium as an important metric and if the net option premium starts trending in a particular direction, it enables traders to participate accordingly. Usually, traders avoid the first few ticks in option premium for any trading day, due to noise factor being on the higher end. The oscillators like RSI also help in gauging momentum for the net premium.
Had a look at the strategy charts! Now the next chapter shall focus on technical indicators and how to study the underlying, so that a suitable option overlay can be done using a variety of them.
FAQs
Does technical analysis work on options strategy charts?
Yes, as it indicates the cumulative demand and supply situation effectively for the option strategy under study. Moving averages, trend lines and other tools for price action analysis can be effectively used.
How do I view charts for options’ strategy?
Firstly, create the strategy in Quantsapp Option Architect. Once the strategy has been thought over and finalised, one can view the chart of net option premium, of that specific strategy by clicking the strategy charts icon.