Strategy charts help in understanding option premium dynamics of a particular option strategy. Now its time for some technical indicators which work well on the underlying and option charts alike.
Ideas
Ideas
.svg)
Intel Junction
Trade
Trade
Orders API
Watchlist
Orders
Positions
Broker Access
Hot Keys
Alert Trigger Order (ATO)
Bracket Order
Target Stoploss Order
Add Broker
Track
Futures OI
Options OI
News
Price & Volume
Alerts
Built-Up Breadth
Built-Up Scrip Symbol
Synopsis Futures OI
Built-Up Sectors
Top Stocks
Intraday Movers
Analyze
Charts
IV
PCR
Expiry
Price & Volume
Charts/ Order & Trade
Multi Strike OI
O&T Watch List
Strategy Chart
Scan
Hist-Futures
Hist-Options
Pairs
Built-Up Scrip OI-Historical
Built-Up Sector Cycle
Built-Up Sector OI-Historical
Built-Up Scrip Cycle
Comparative Analysis
Tools
Easy Strategy
Strategy Builder
Quant Models
Essential Tools
Optimizer Find Strategy
Optimizer Find Specific
Optimizer My Forecasts
Optimizer Constrains
Learn
Live
Self Learning
Events
Webinars

Book a Session


Chapter 6
Technical indicators

Money Flow Index
The Money Flow Index (MFI) is a momentum indicator that measures the flow of money into and out of a security over a duration of time, or specific time period. It incorporates volume also in the calculation as compared to the RSI, which considers only price.
Oversold levels typically occur below 20 and overbought levels typically occur above 80. These levels may change depending on market conditions and are generally not reason enough to buy/sell; and traders should consider additional technical analysis tools to confirm the security's turning point. During strong trends, the MFI may remain overbought or oversold for extended periods and oscillate in the overbought/oversold zone.
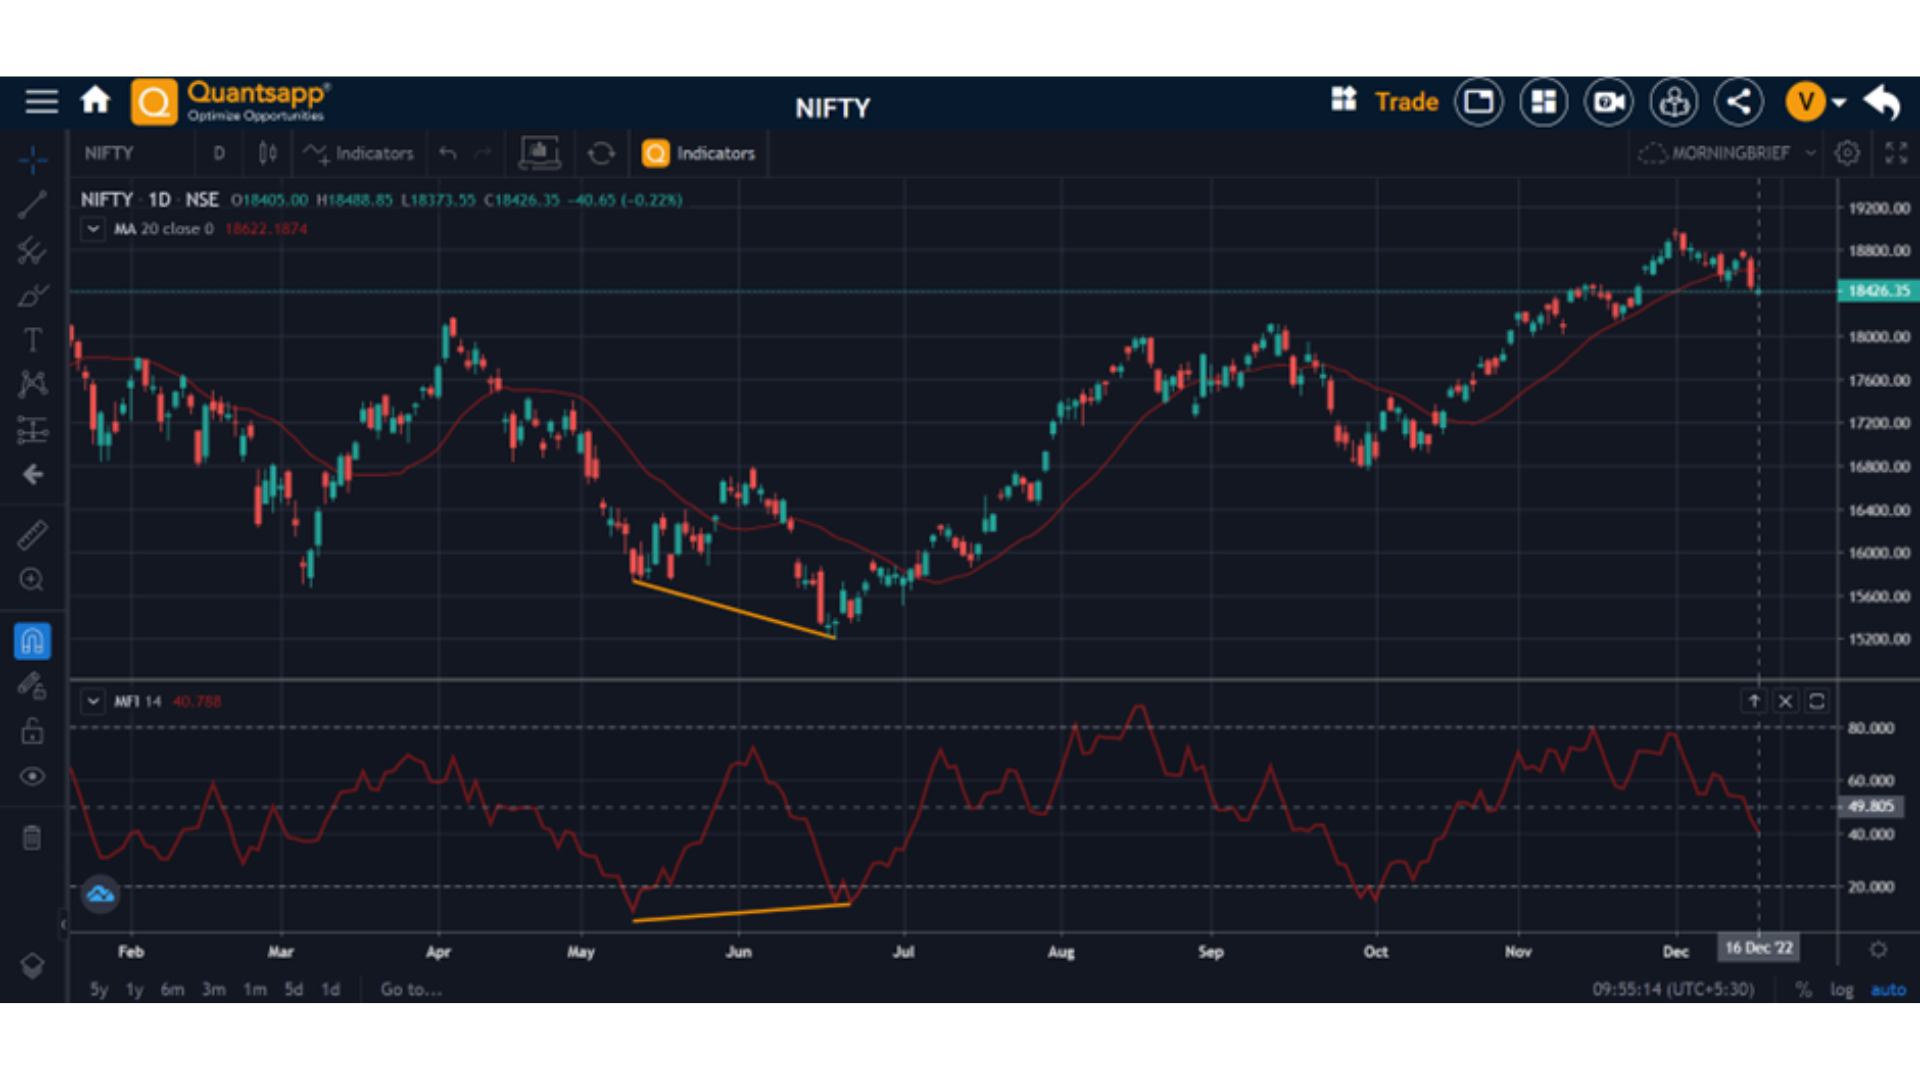
The money flow index has characteristics similar to RSI oscillator, as discussed earlier. The chart above shows Nifty on daily time frame, with a positive divergence, implying prices head lower, while MFI moves higher, as shown with the lines on corresponding data sets. The divergences are of typically two types, the above chart shows a positive divergence, suggestive of a positive price action in coming days.
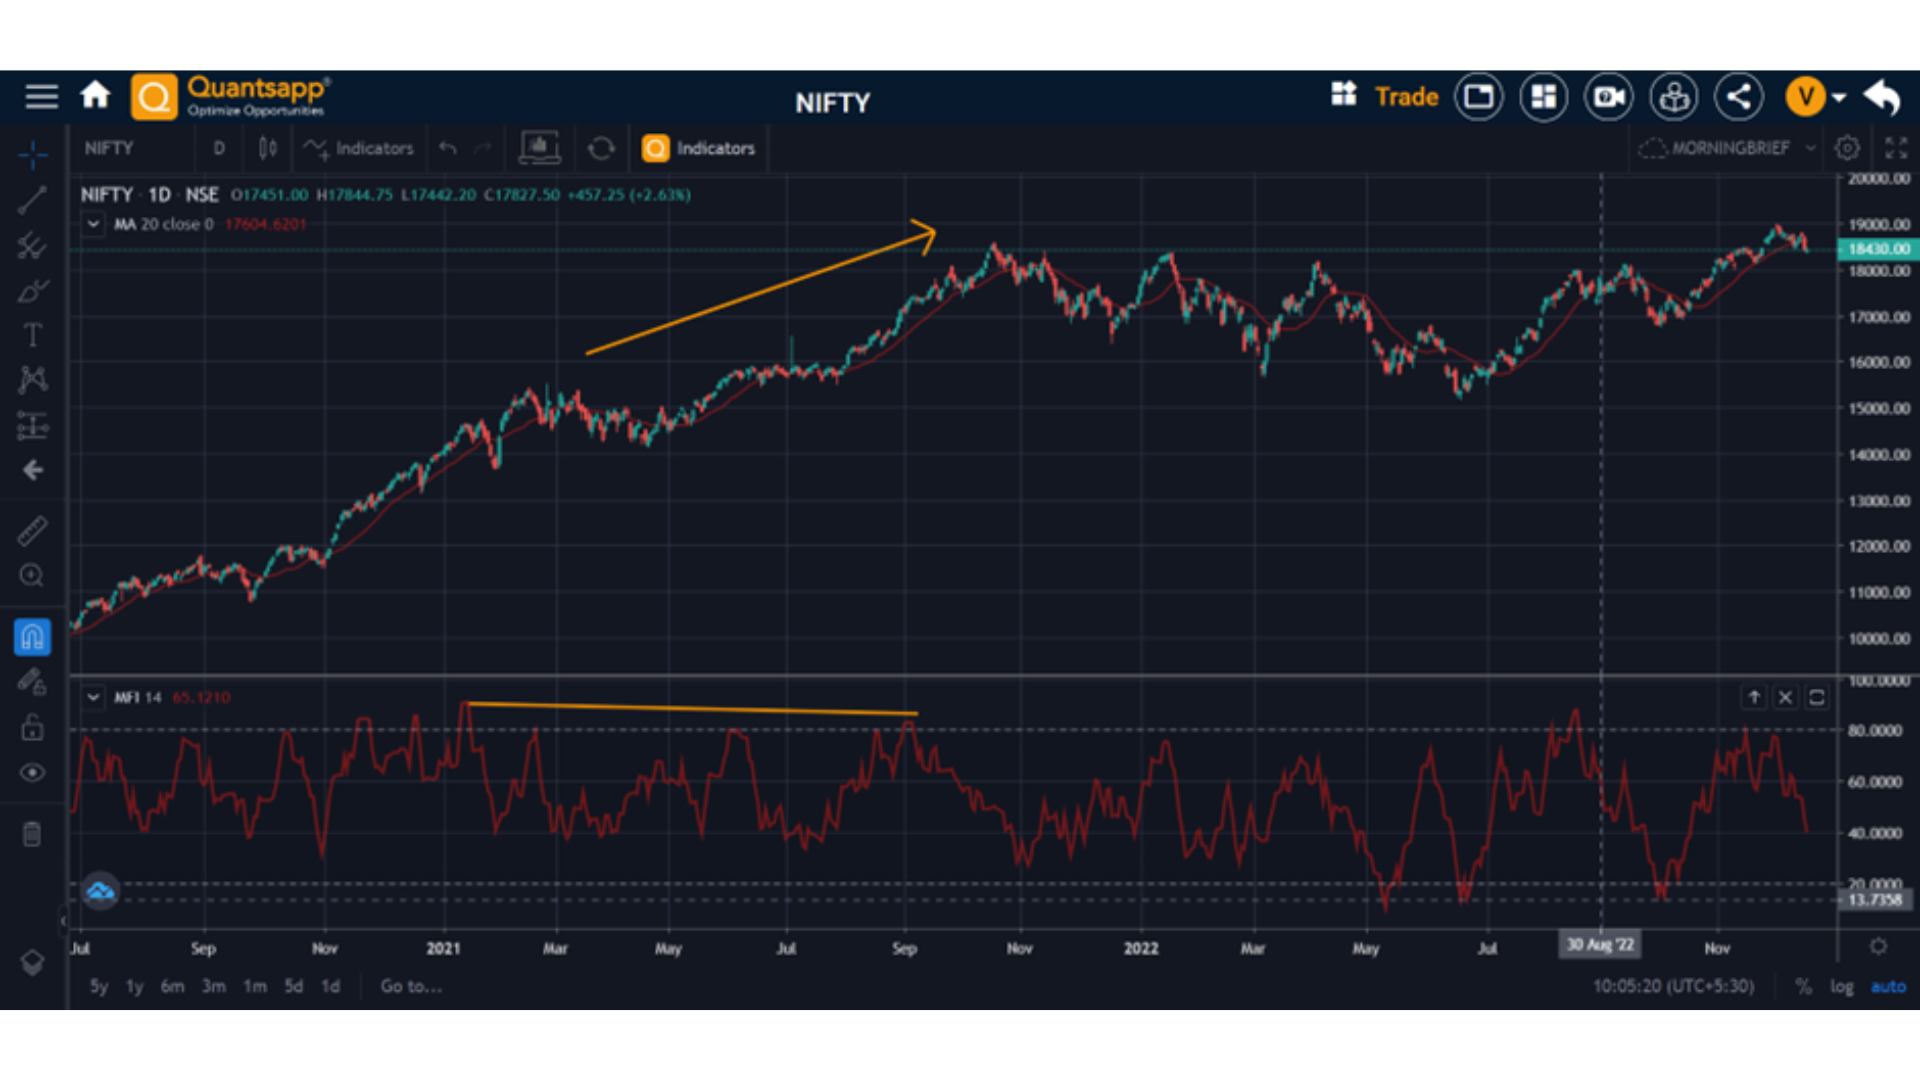
Similarly, negative divergence is evident in the above chart, where prices scale a new high, but MFI scales a lower high, as shown by the two orange lines which diverge. These charts can be easily view through Quantsapp web app and mobile app also.
Relative strength index (RSI)
Relative Strength Index (RSI) is a momentum oscillator, oscillates between zero and 100. Traditionally the RSI is considered overbought when above 70 and oversold when below 30. But it would be a wrong hypothesis to just sell when overbought and buy when the underlying is oversold, as per RSI reading. This is because, markets can stay overbought and bullish much longer than one can expect; in such a case, RSI stays overbought and meanders in the upper zone. Similar situations can arise on the bearish end, where markets or Nifty can remain oversold and RSI can languish.
The key phenomena to look at are divergences or failure swings to trade the market.
Divergences:
Positive Divergence
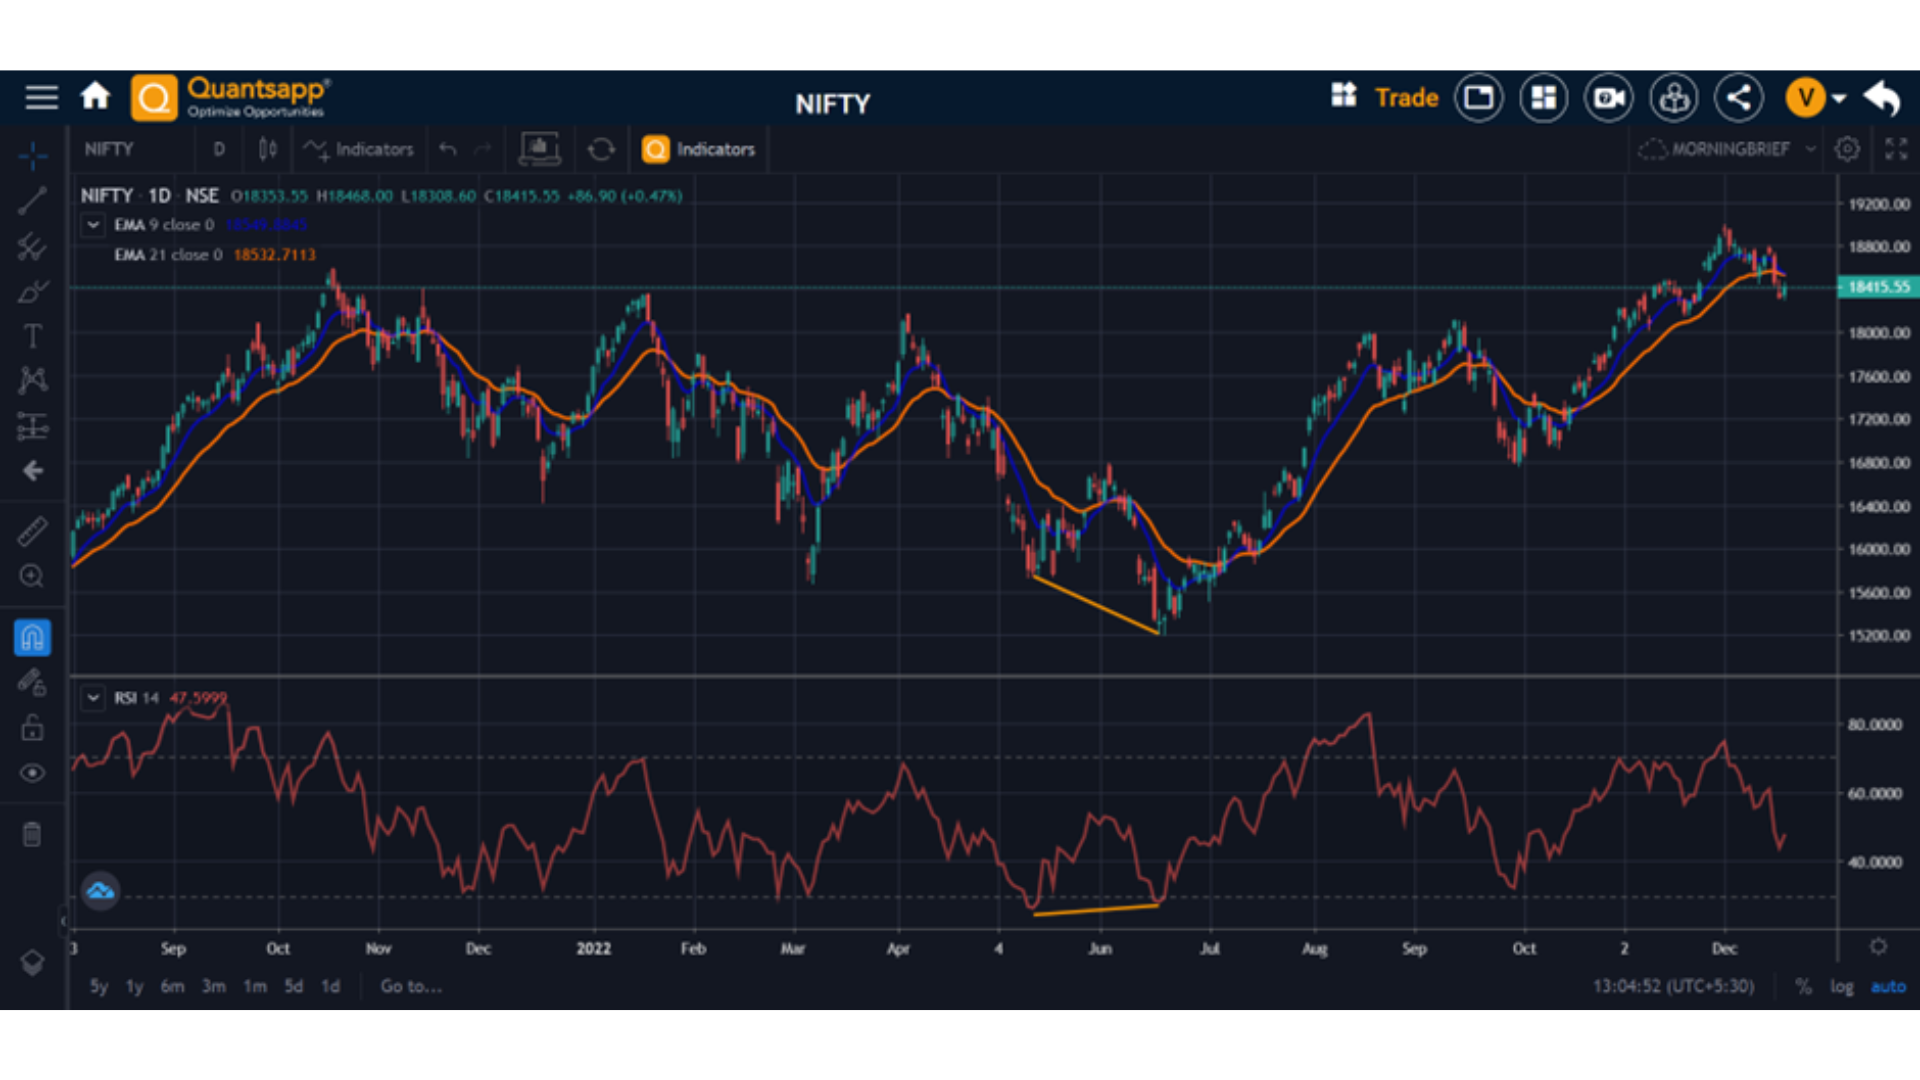
The Nifty stock index chart has exhibited positive divergence as indicated by orange lines. Between 13 May 22 and 17 June 22, during this period, prices made a lower low, while RSI made a higher low. It has been indicated in the chart, by orange lines. This is usually associated with a positive move, post the divergence in prices, which indeed has been noticed.
Negative Divergencee
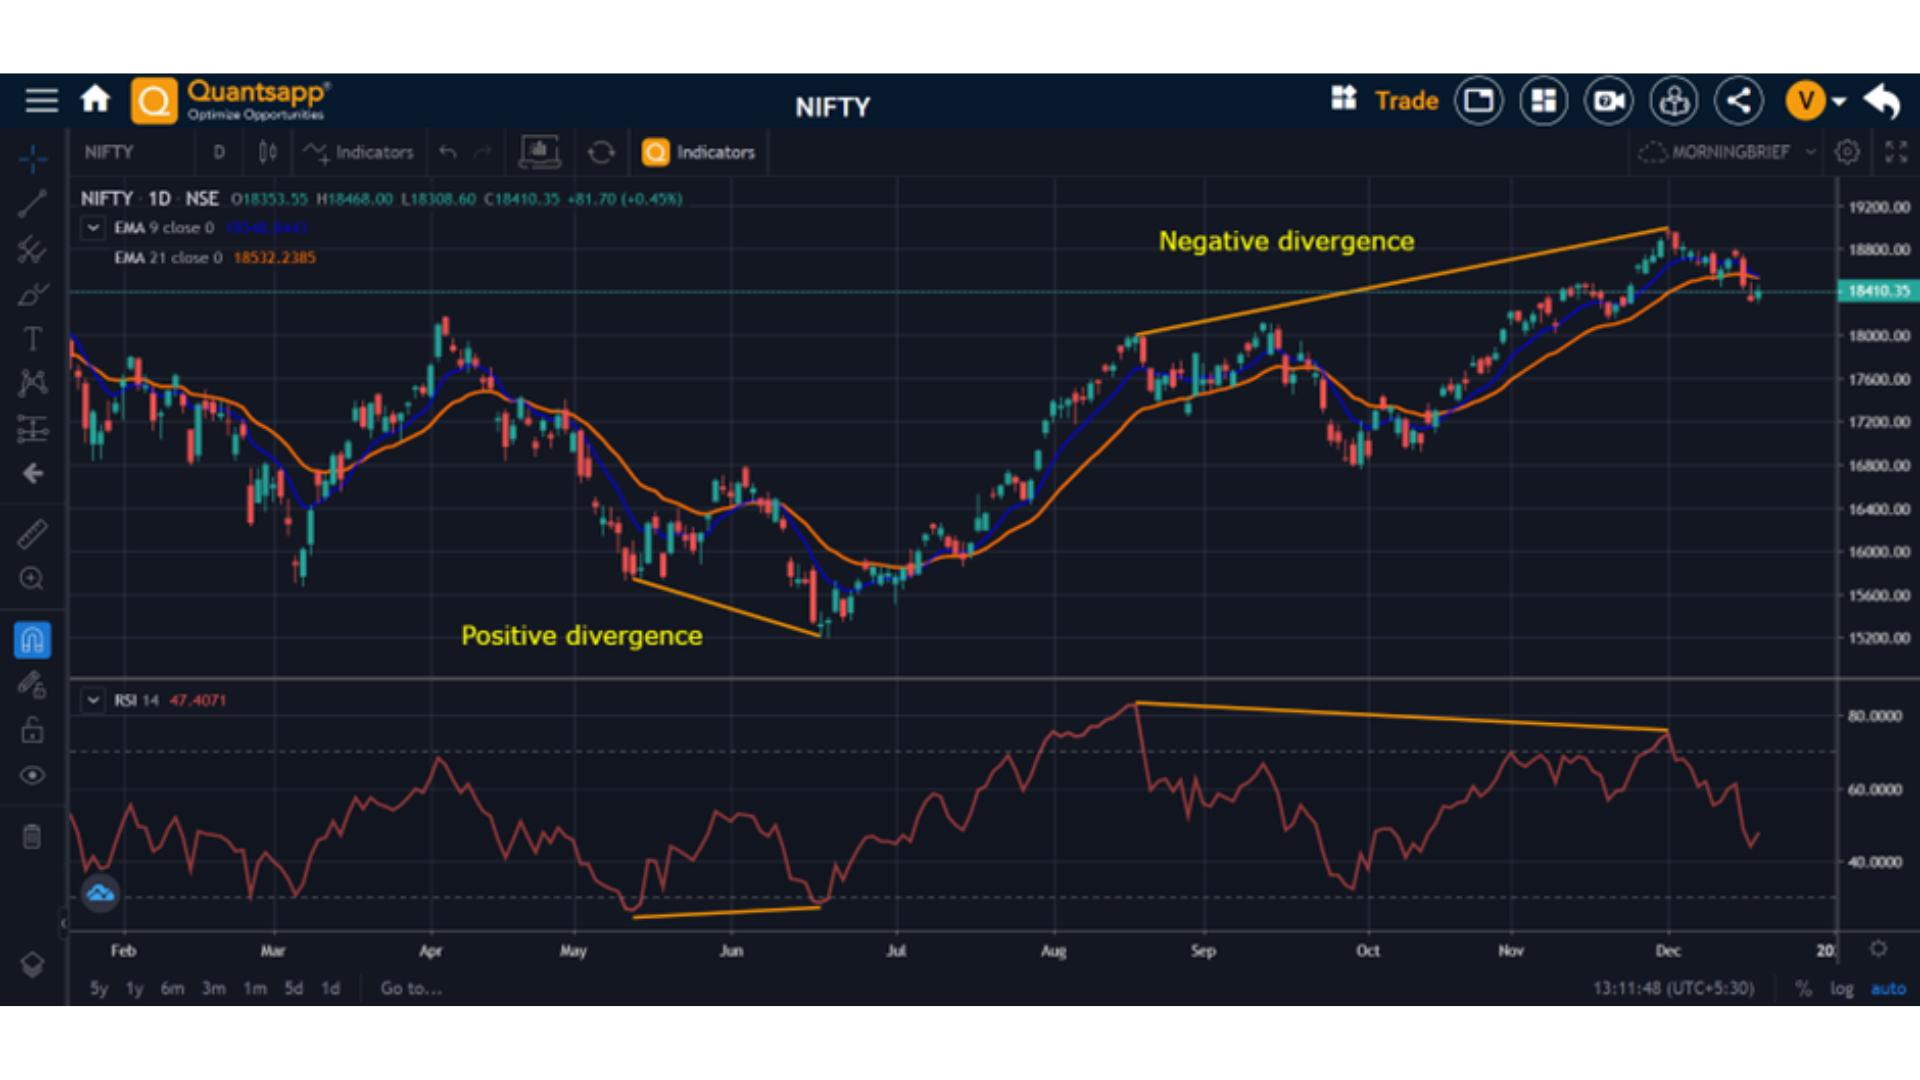
The Nifty stock index chart has exhibited negative divergence, also, as indicated by orange lines. Between 18 Aug2022 and 1 Dec 2022, during this period, prices made a higher high, while RSI made a lower high. It has been indicated in the chart, by orange lines. This is usually associated with a negative move, post the divergence in prices, which indeed has been noticed.
Failure Swings:
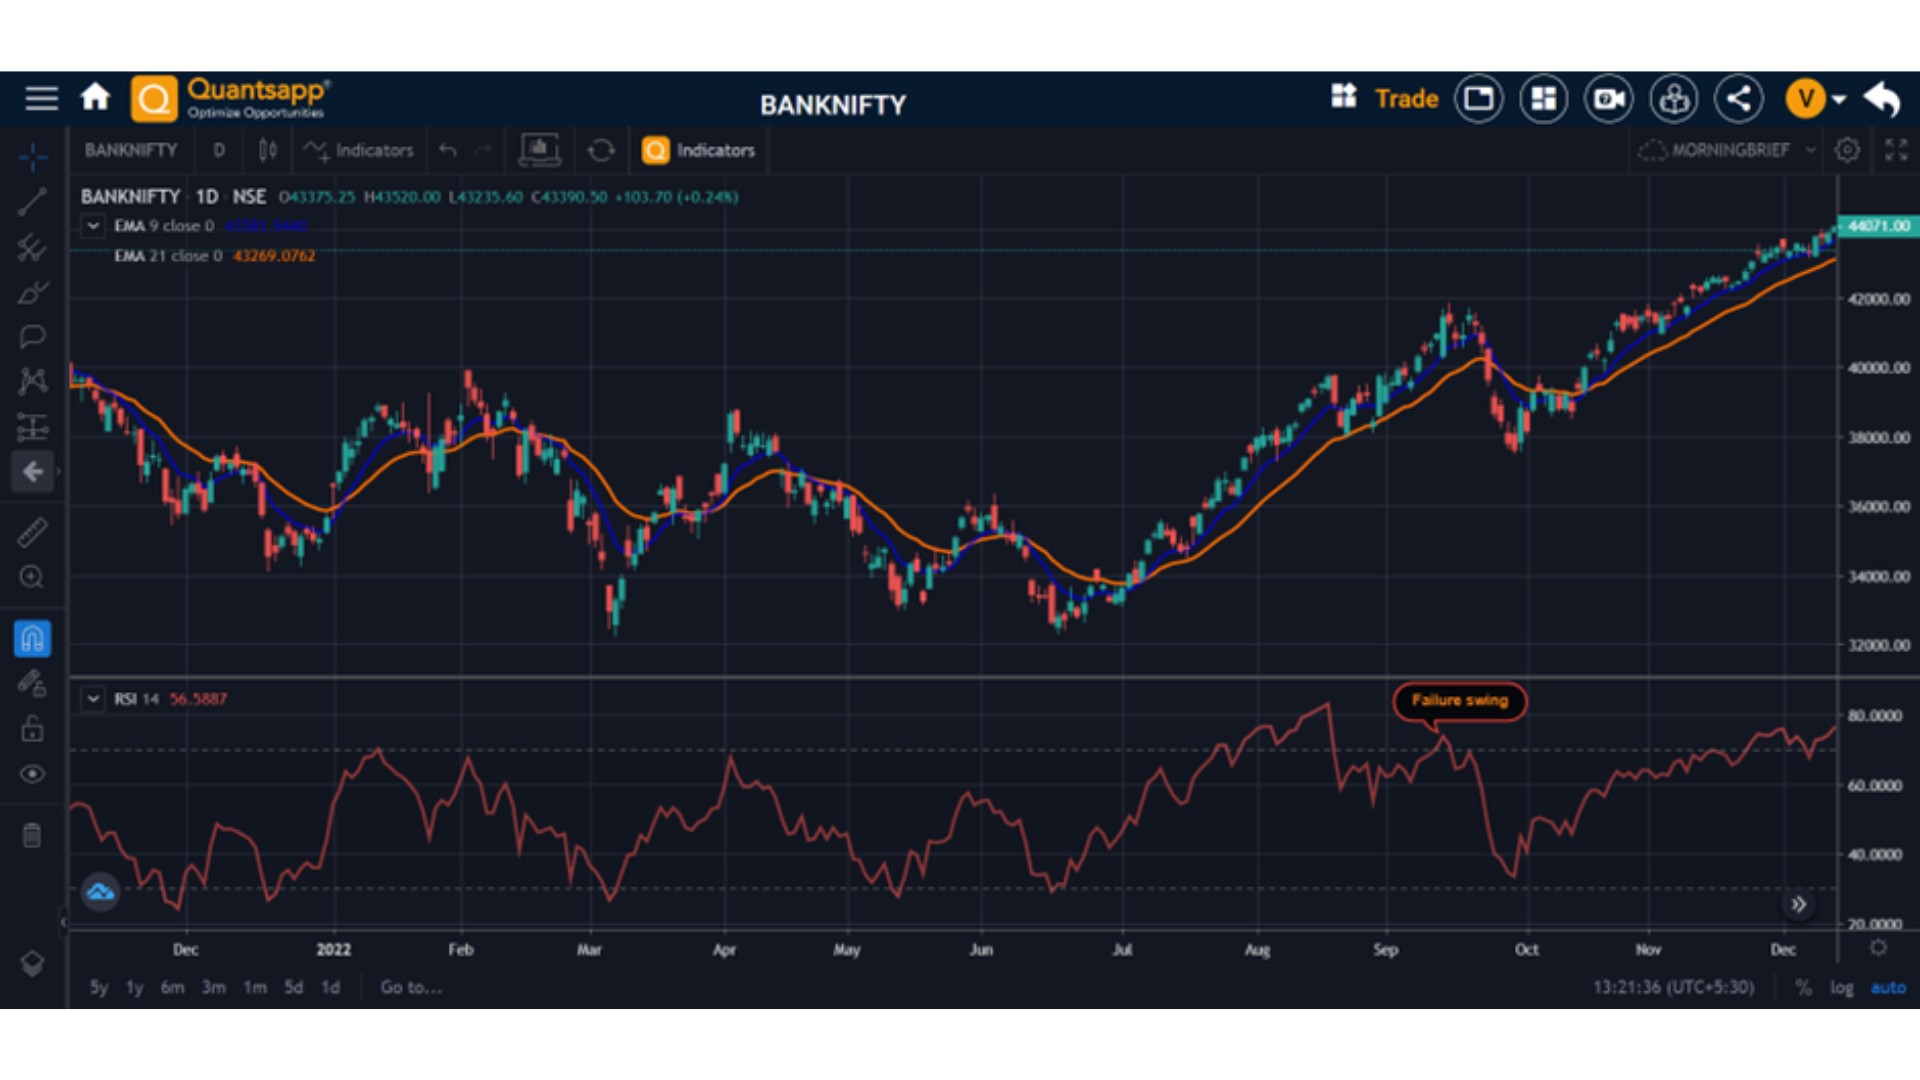
During the bullish phase, when RSI scales a high, in the overbought zone and retraces, only to make a second high which is unable to surpass the prior one and also creates a kind of “M” pattern is a failure swing. This is suggestive of a looming bear trend. Of course, the situation is vice versa for a bearish market/underlying like BANKNIFTY/NIFTY or other F&O stocks. BankNifty daily chart indicates a failure swing, between 14 Sep 2022 and 20 Sep 2022.
Put Call Ratio
The PCR or the Put Call Ratio indicator is a market sentiment indicator. It measures the total Put volume traded versus the total Call volume traded, known as Volume- PCR.
PCR = Total volume of Puts written/ Total volume of Calls written. if PCR>1, then it shows bullishness. And if PCR<1, it shows bearishness. We can also study the historical support and resistance level of PCR values to find the extreme market sentiment at both ends.
OI-PCR= Total OI of Puts/ Total OI of Calls, indicating that more puts are written, so market is bullish, as put sellers are aggressive as compared to call sellers. The vice versa is true for higher call sellers. It is important to realise that extremely/significantly high OI-PCR creates a sense of caution, what if, the underlying is getting over bought or exhibiting times of greed. While significantly low OI-PCR is for traders to take a contrarian view, saying that its oversold and extreme pessimism has taken over.
Option buying is done by small and retail investors, in general. In any F&O market, the put writing is typically done by experienced traders and institutions.
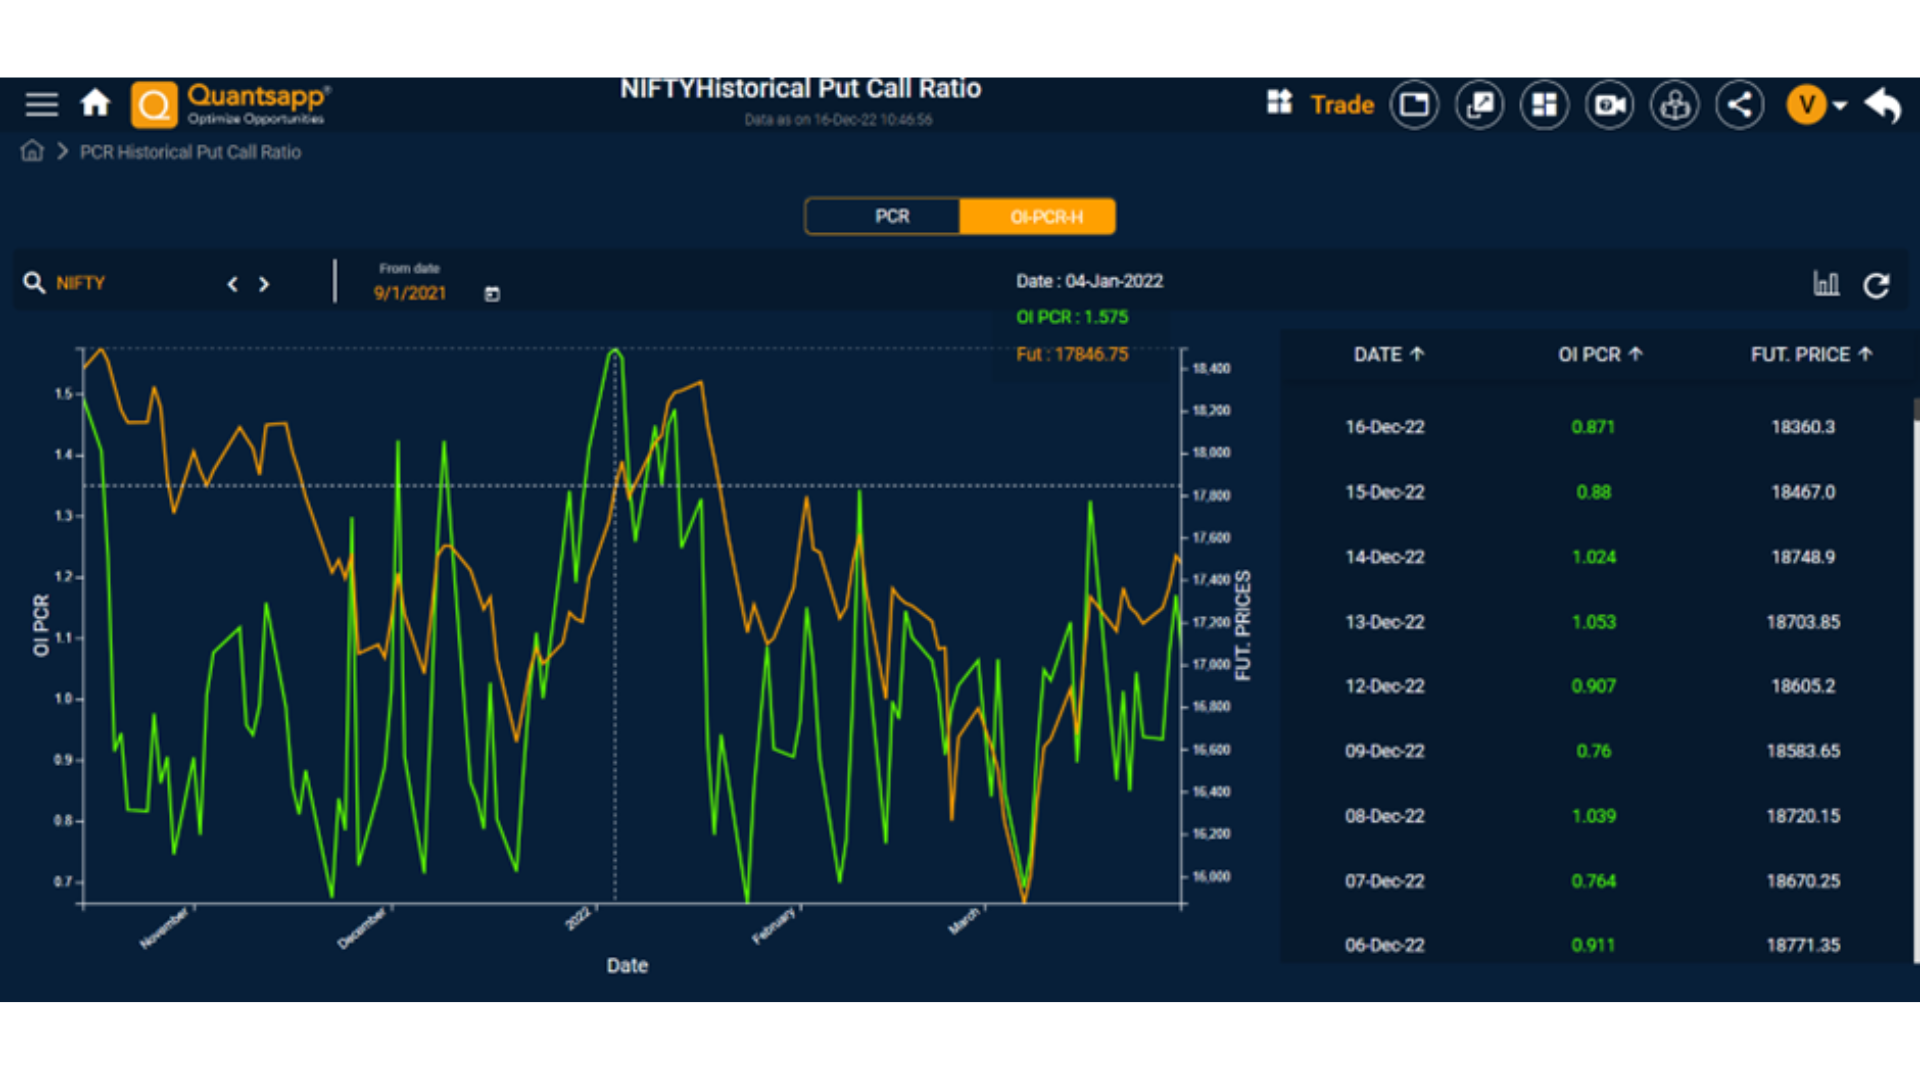
On 4 Jan 2022, OI-PCR hit a high of 1.575 on Nifty and continued to drop post that peak. The drop wasn’t instantaneous, but several failed attempts to rise back, followed by capitulation, falling rapidly from 17 Jan 2022. During this period of meandering of OI-PCR to lower end, Nifty also dropped, reinforcing the belief that extreme values of OI-PCR act as contrarian indicator, while mediocre range Nifty follows OI-PCR.
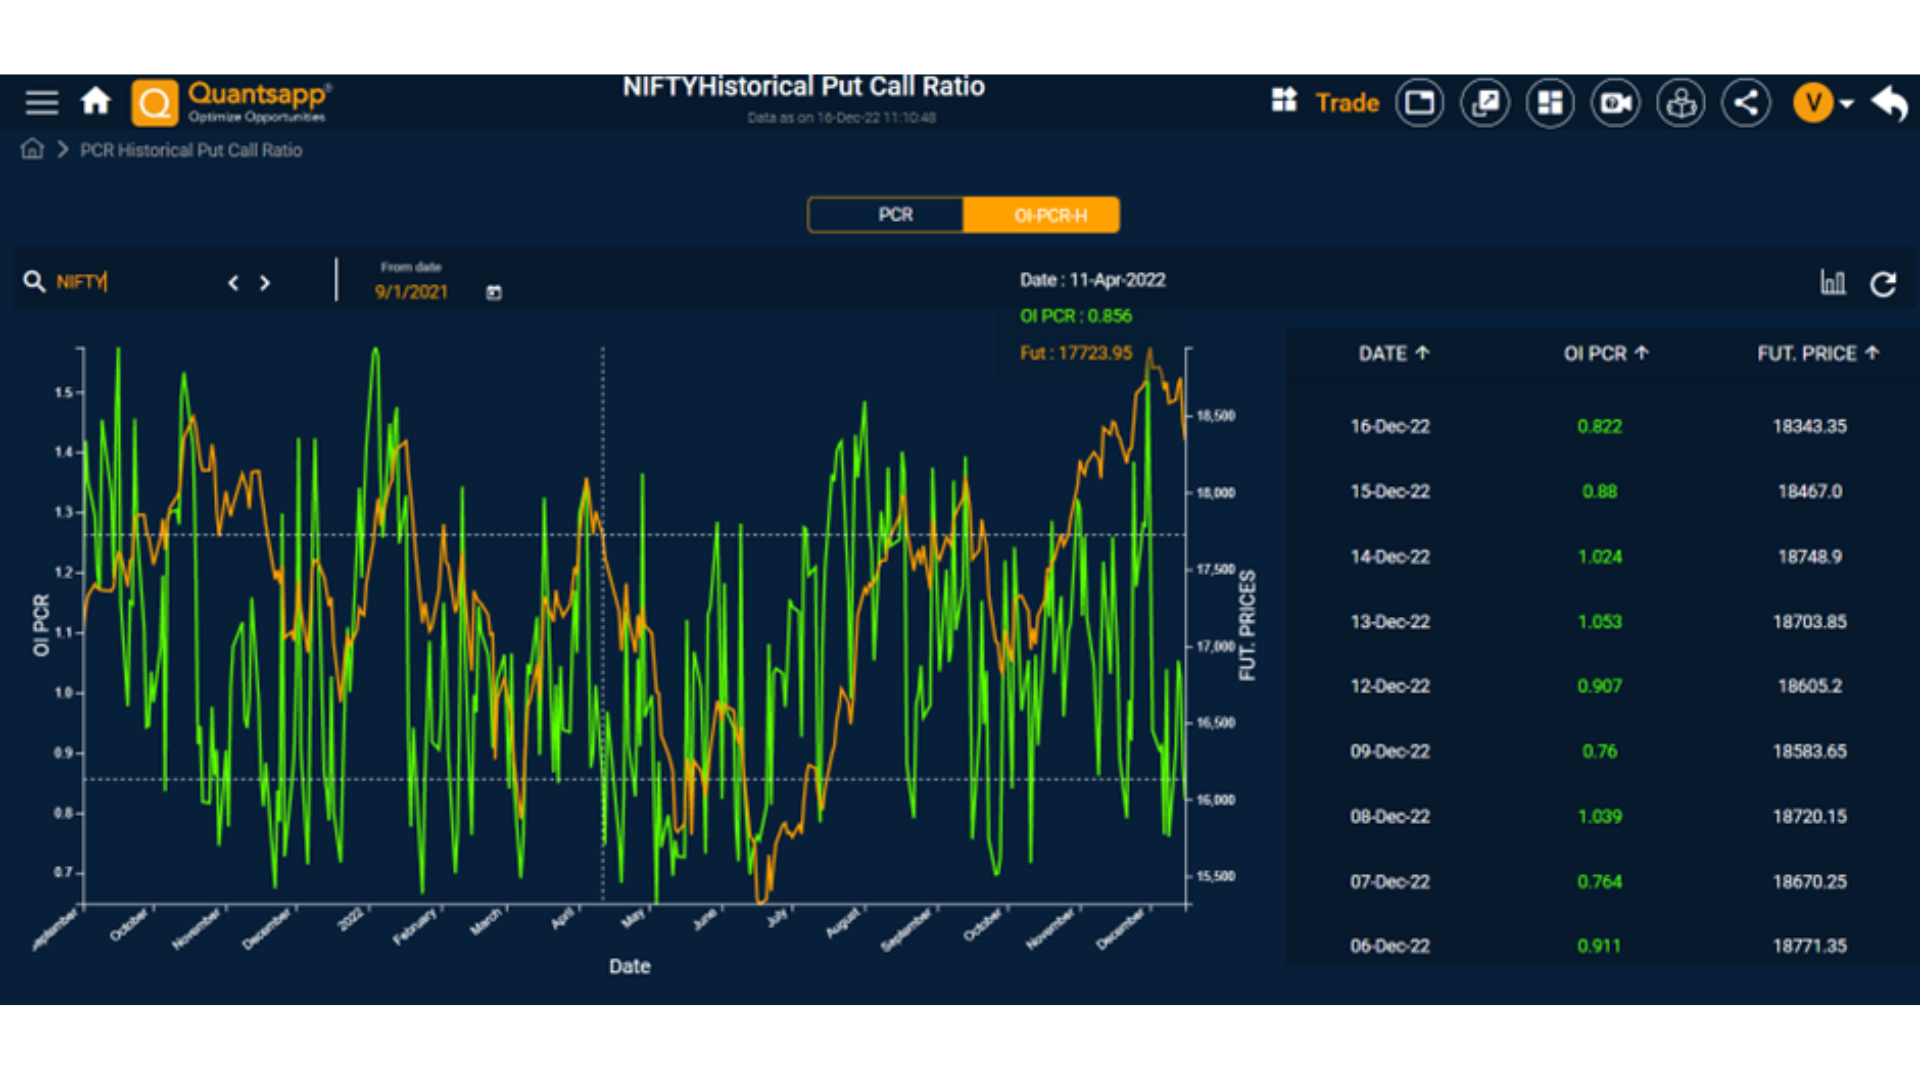
We witness that the peaking of OI-PCR and the peaking of Nifty or any underlying is about the same time and the dip or bottom in OI-PCR symbolises a possible turning point in Nifty (or any underlying like F&O stocks) indicating a bottom. The Put call ratio is indicated in green and Nifty is in orange colour. It can be easily studied across in Quantsapp PCR tool.
After having poured over the technical indicators, its time we traverse to Order & Trade book data.
FAQs
Which are the effective Technical indicators well suited to understand price action?
There are several suitable indicators in Technical Analysis, but Relative strength index, Money Flow Index and MACD are important oscillators, which enable the traders in spotting trend changing nuances.
How to spot trend reversals using technical indicators?
Trend reversals can be spotted in Relative Strength Index (RSI) and Money Flow Index (MFI) using divergences like positive divergence or negative divergence. Also, failure swings are an important characteristic in momentum oscillators like RSI.
What is PCR, Put-Call ratio?
The PCR or the Put Call Ratio indicator is a market sentiment indicator. It measures the total Put volume traded versus the total Call volume traded, known as Volume- PCR. A similar ratio called the OI-PCR involves the use of open interest of puts versus open interest of calls.
How can PCR be used to understand market sentiment?
Historical OI-PCR needs to be studied, to understand the relative positioning of the ratio. For eg. The extreme values of OI-PCR act as contrarian indicator for Nifty50, while mediocre range NSE market index Nifty50, tends to follow OI-PCR