Login

Analysis using Order & Trade Book

Chapter 7

Analysis using Order & Trade Book

After having understood the approach to option Greek charts, we now would start looking at some sound analytical approach to order and trade book.

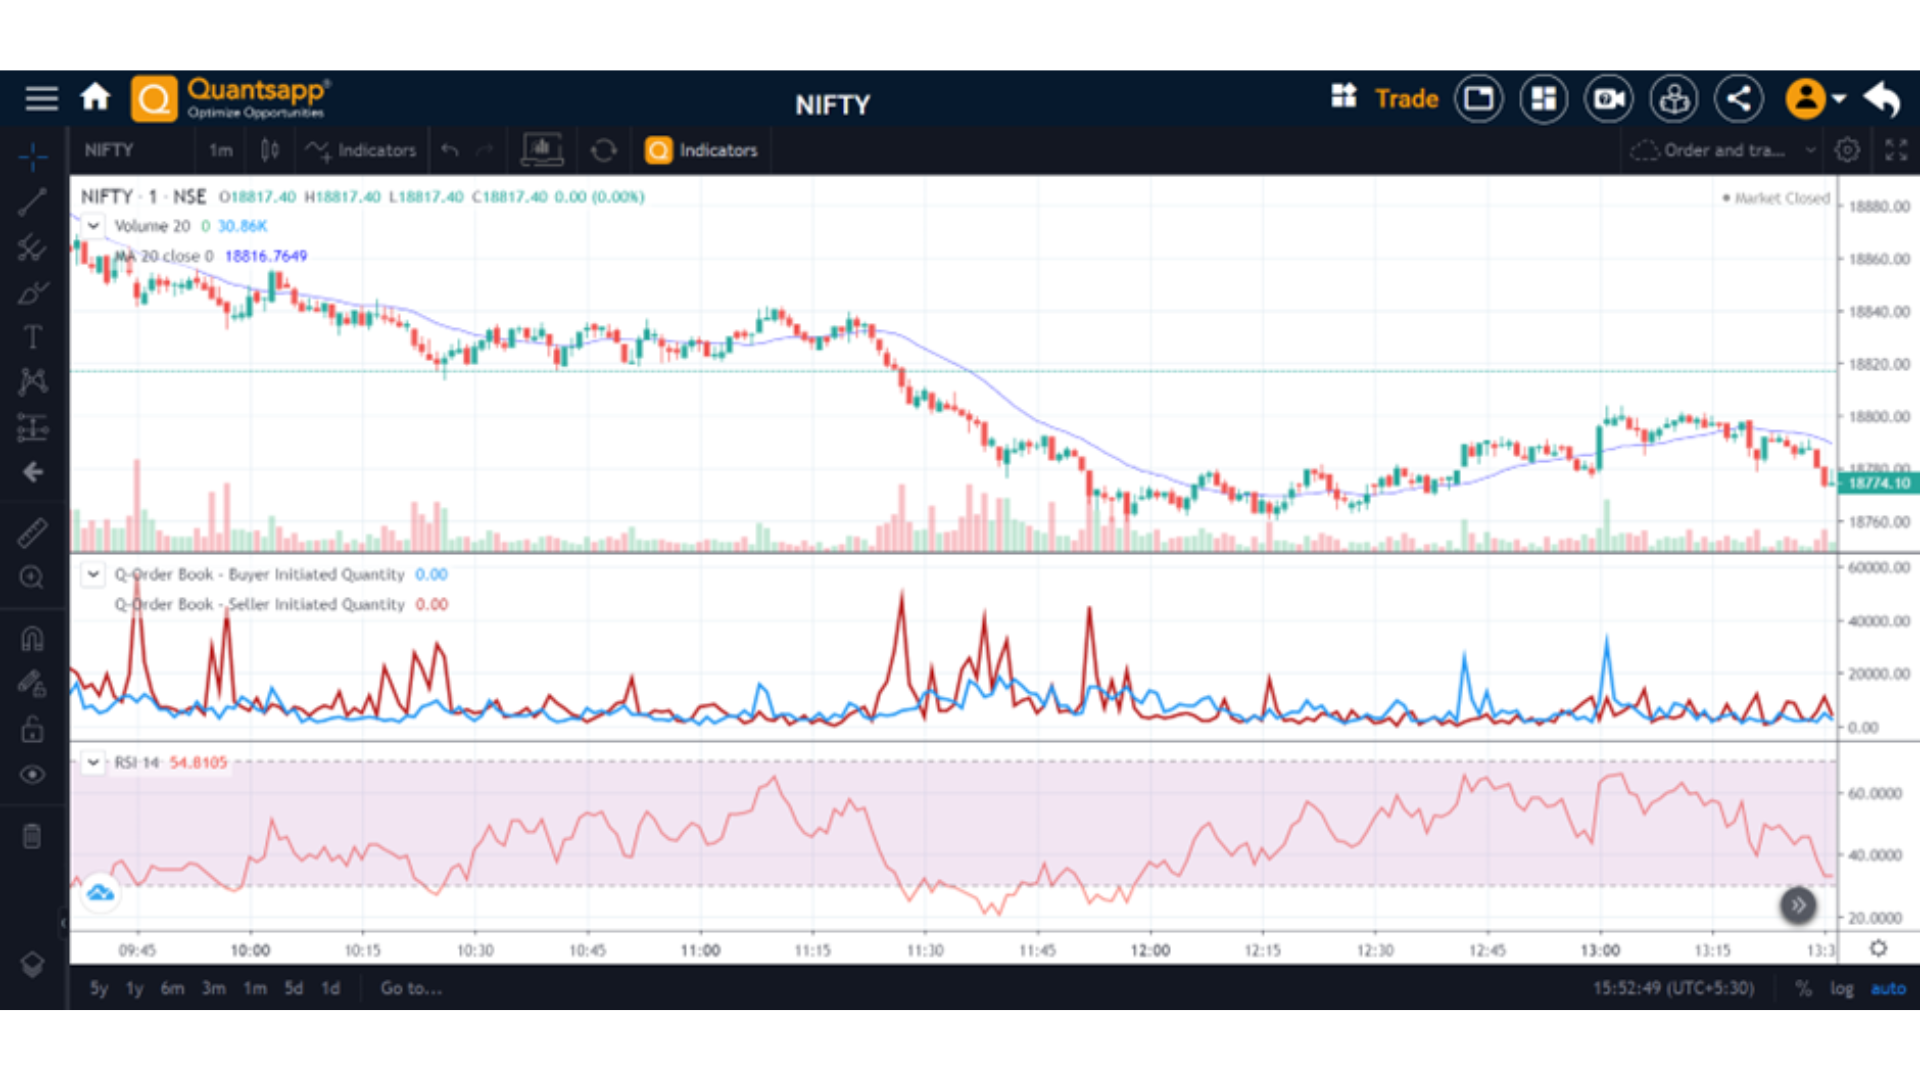
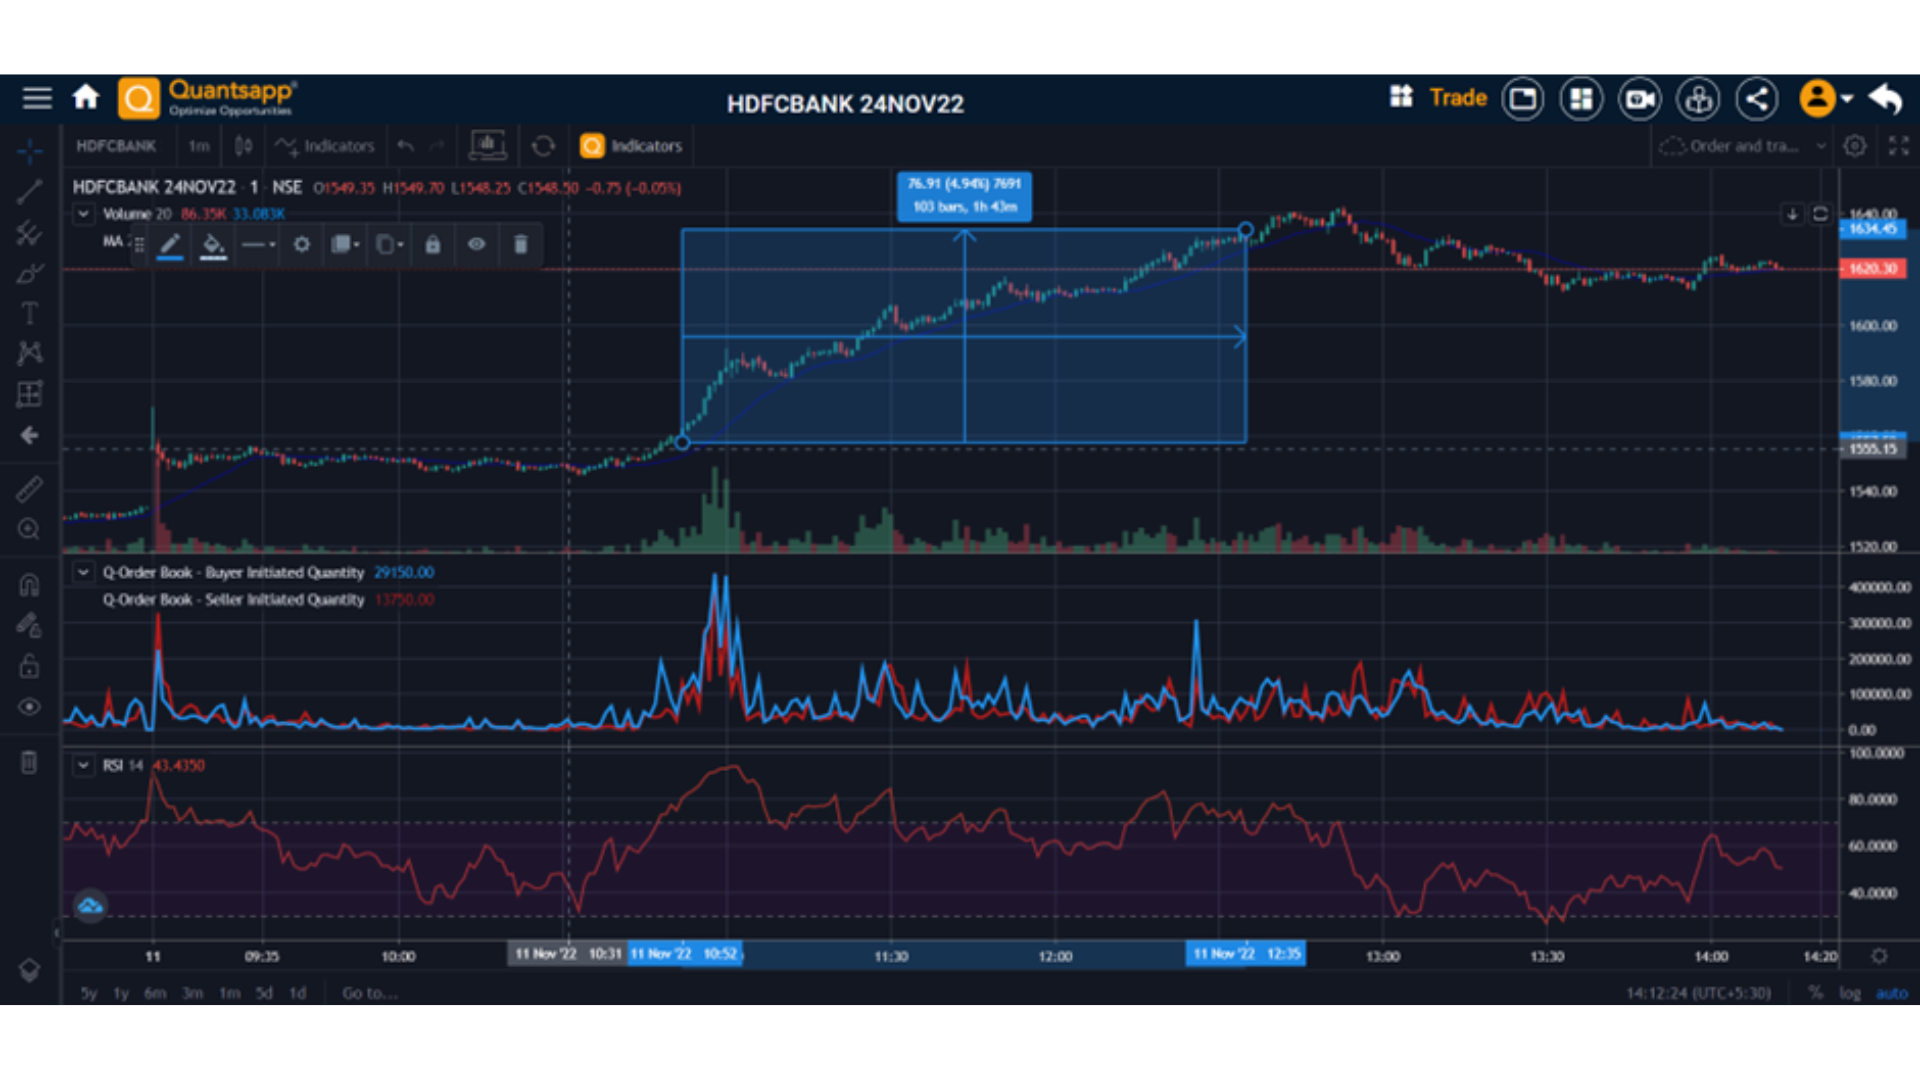
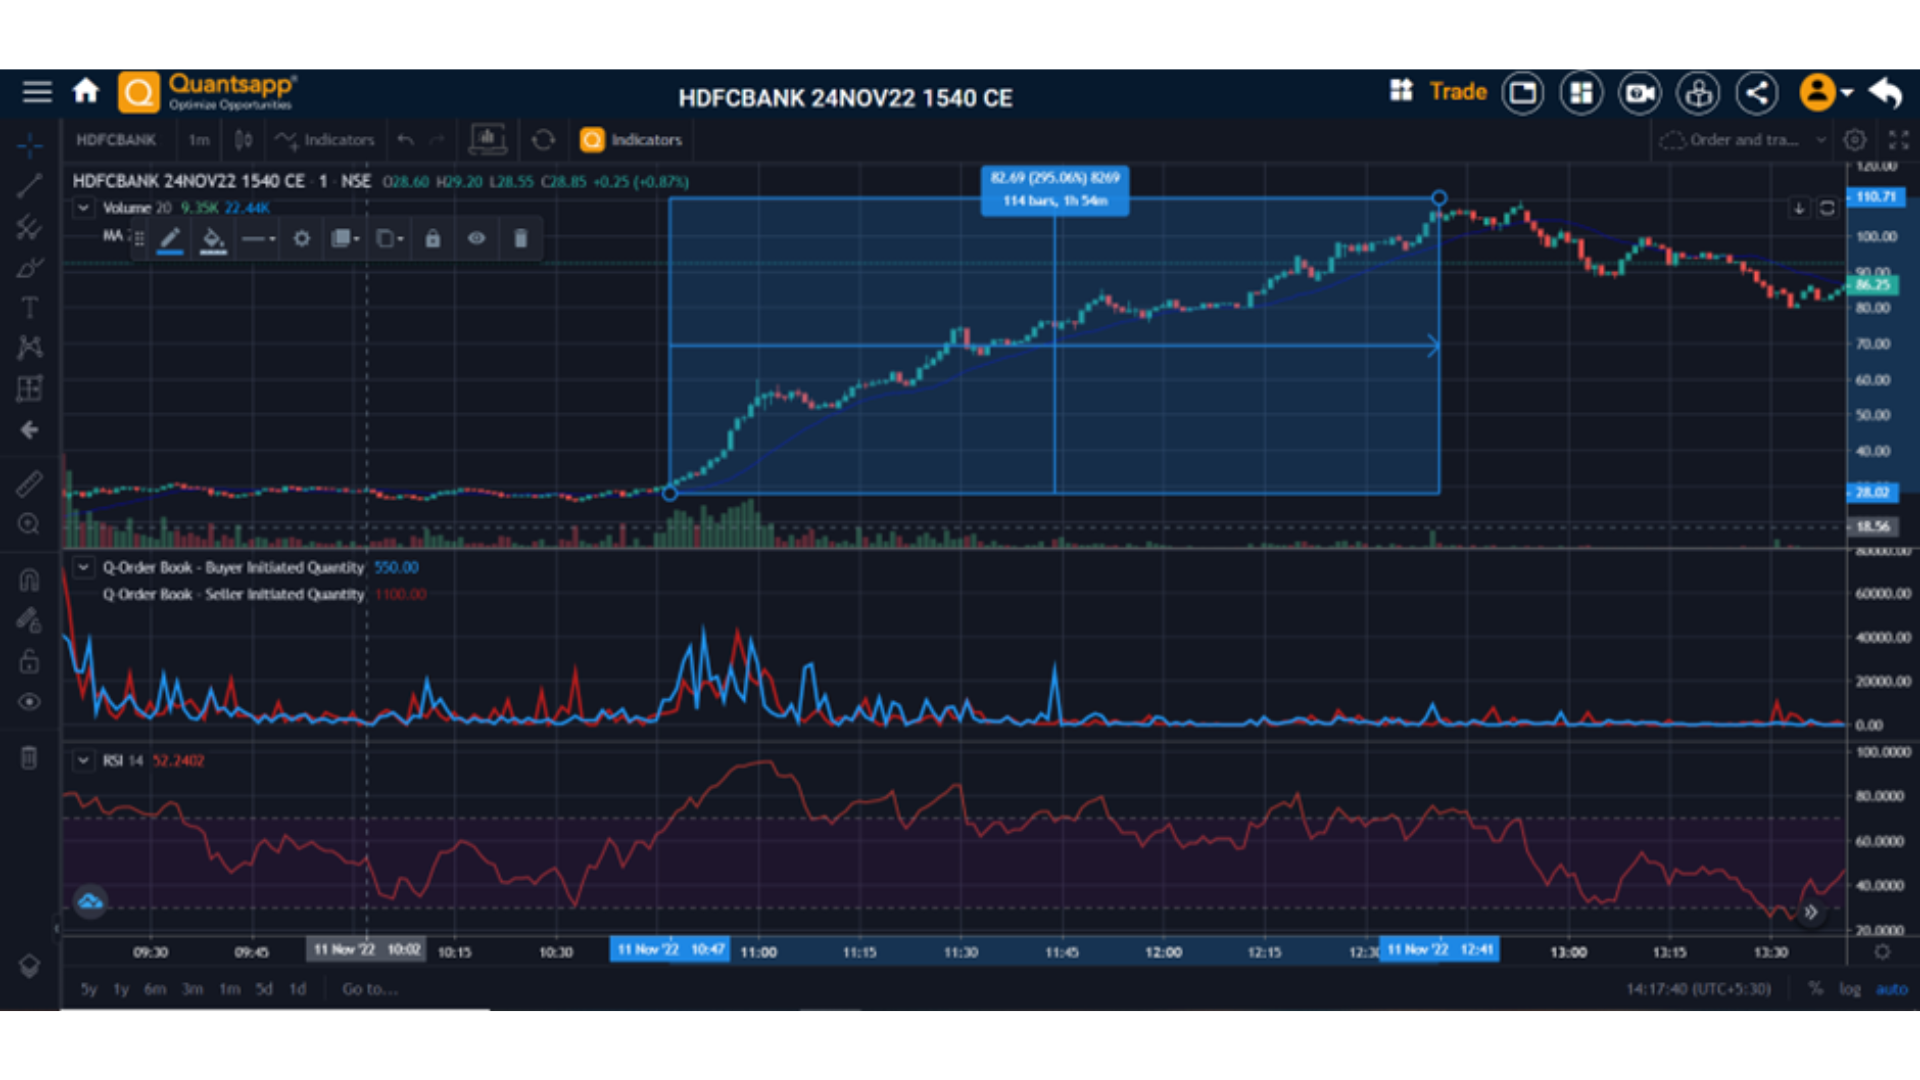
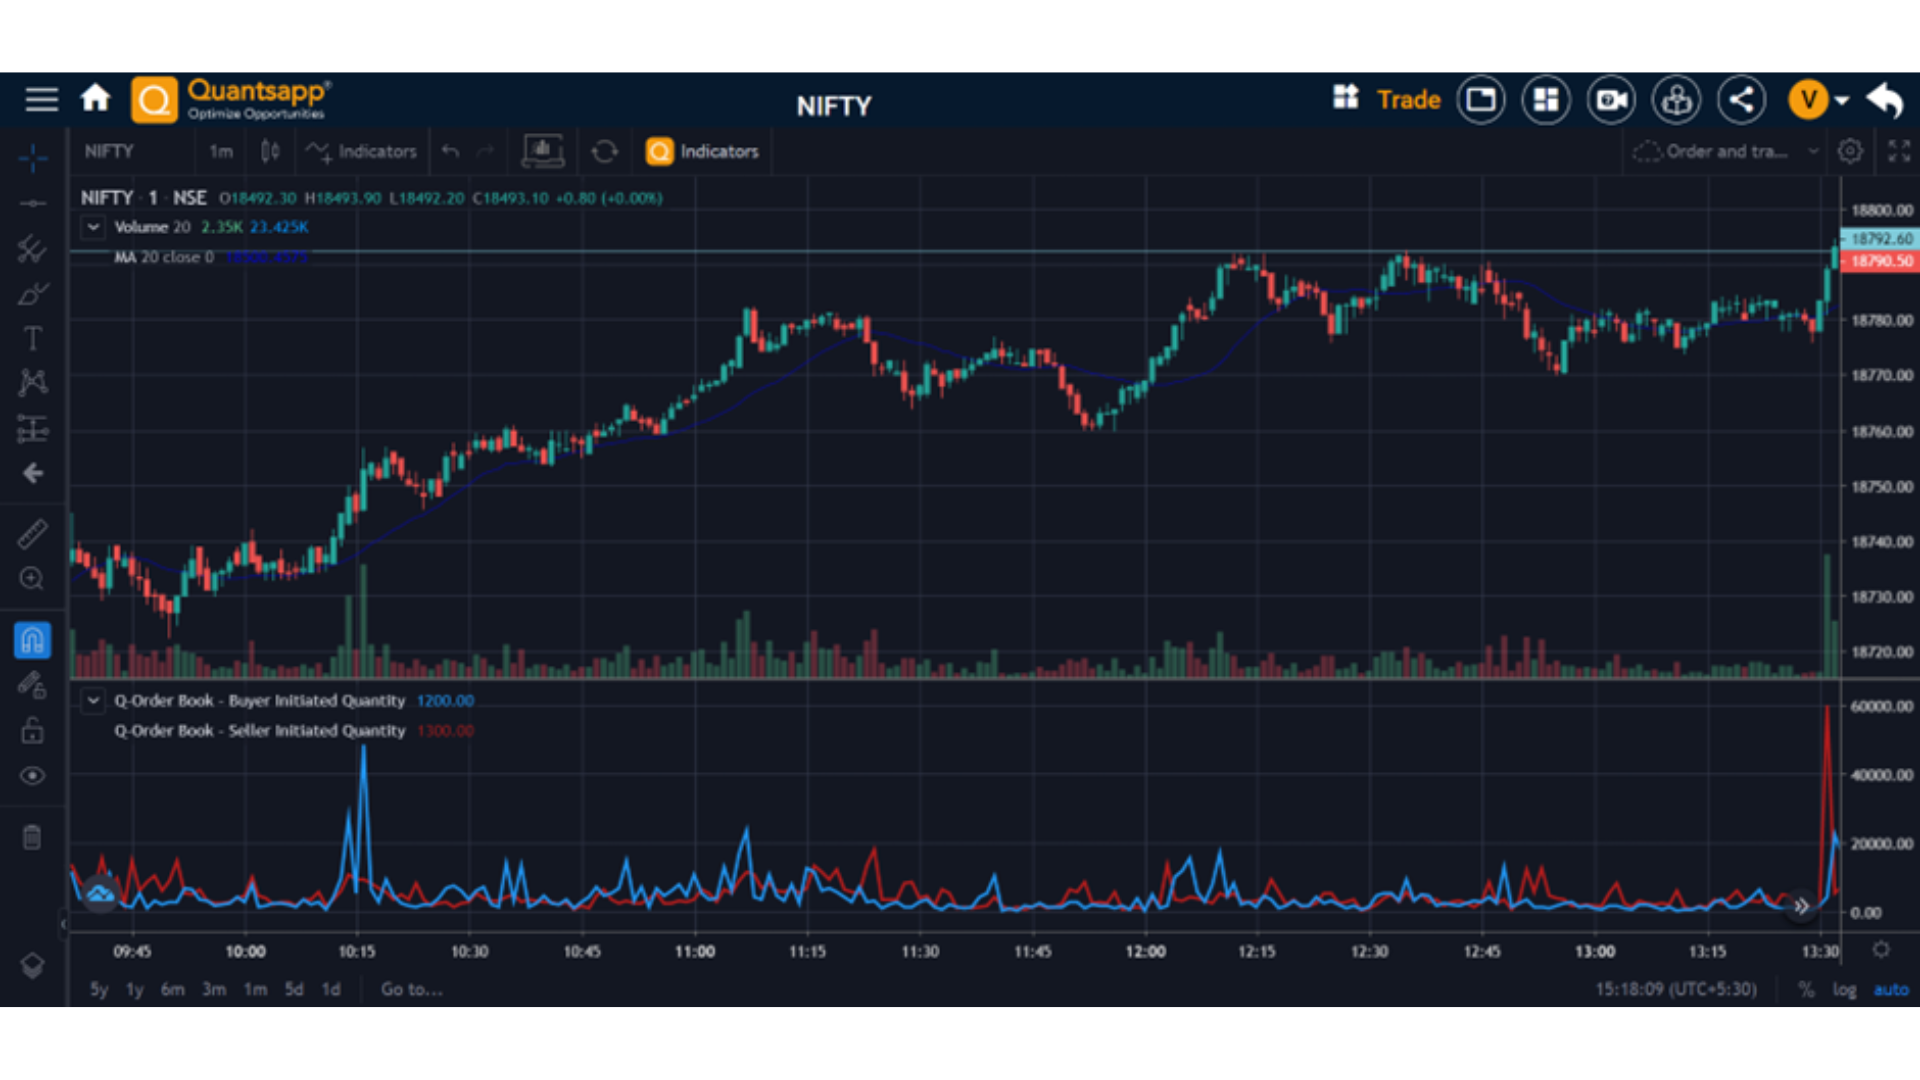
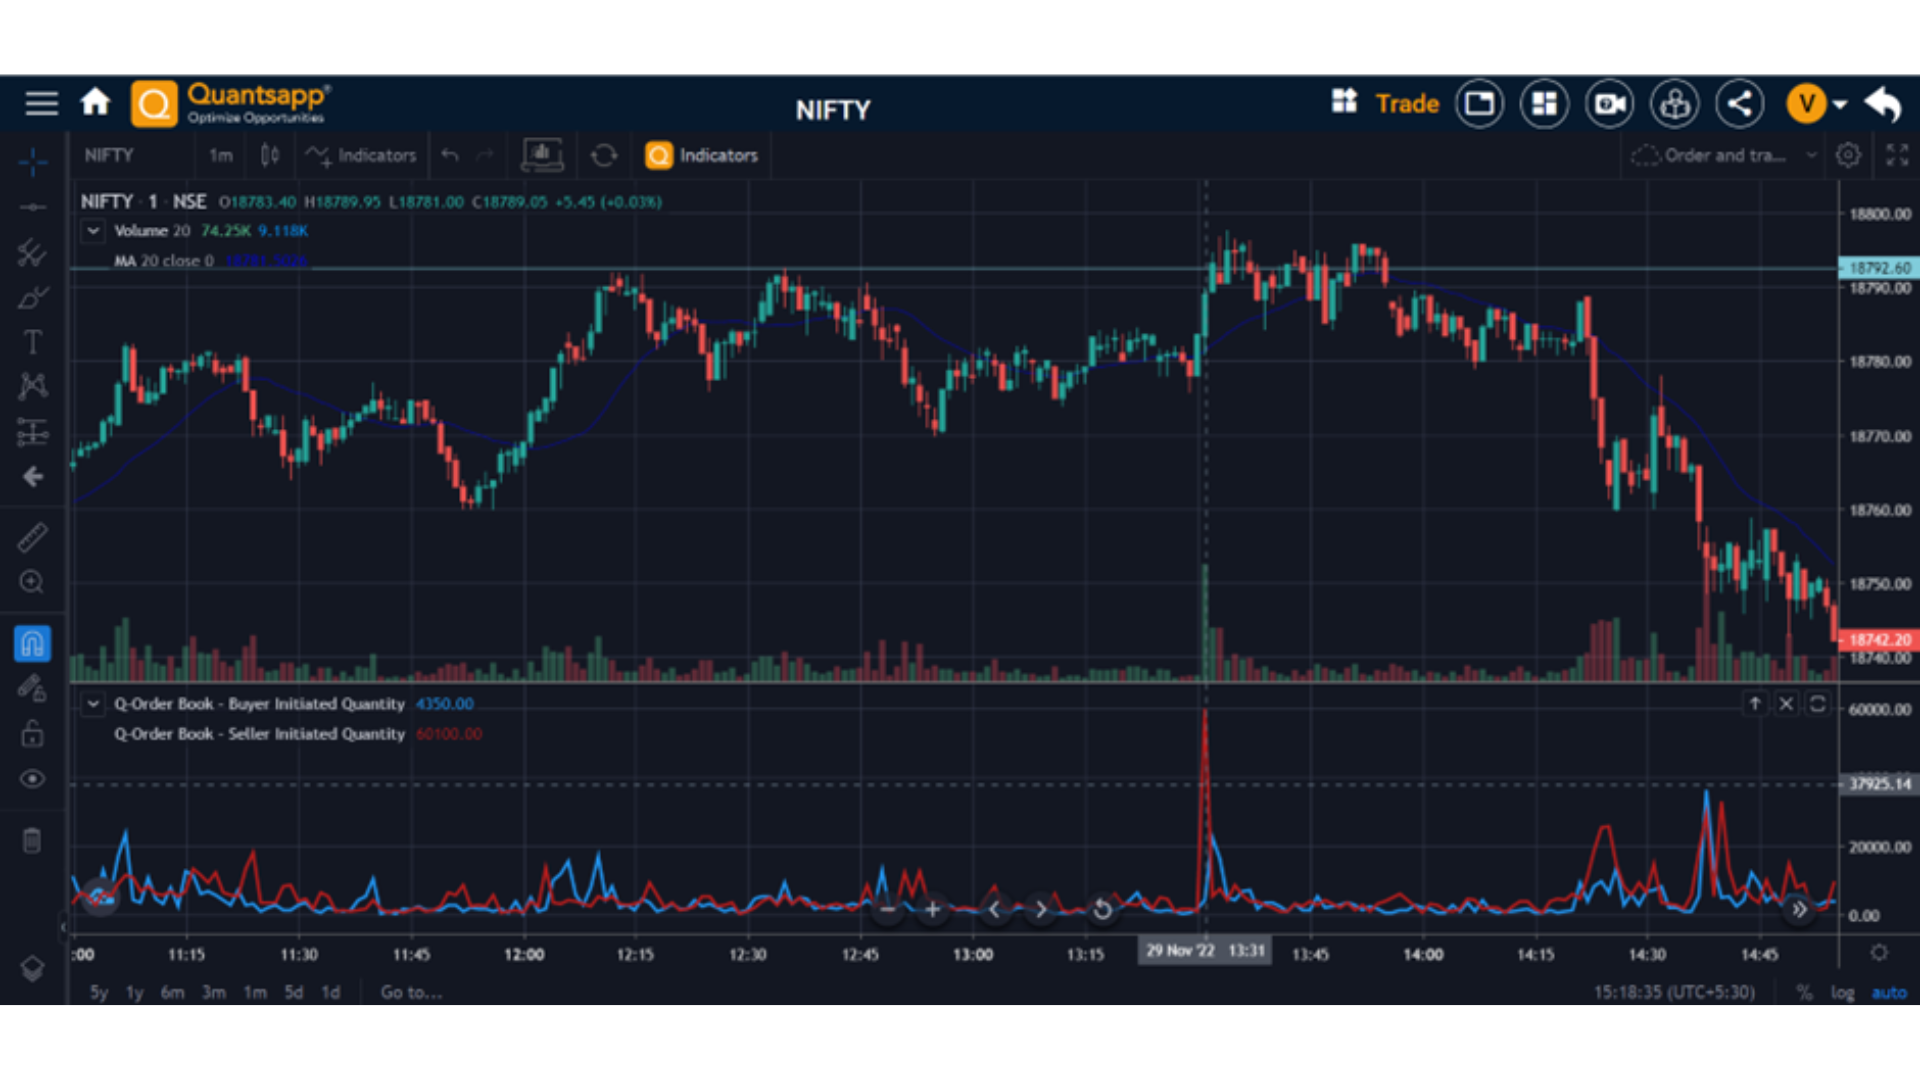
Quantsapp has unique data analytics related to real time order and trade flow, (Order and Trade Book) that provides an edge to use order book data with any trading system. It helps understand the behaviour of Traders in real time by stepping into the data window which was earlier available only to institutional players. Typical prevalent order book is Best 5 participants on Bid and Ask, the proprietary algorithm of Quantsapp allows to scan the full order and trade book to enable better decision making.            

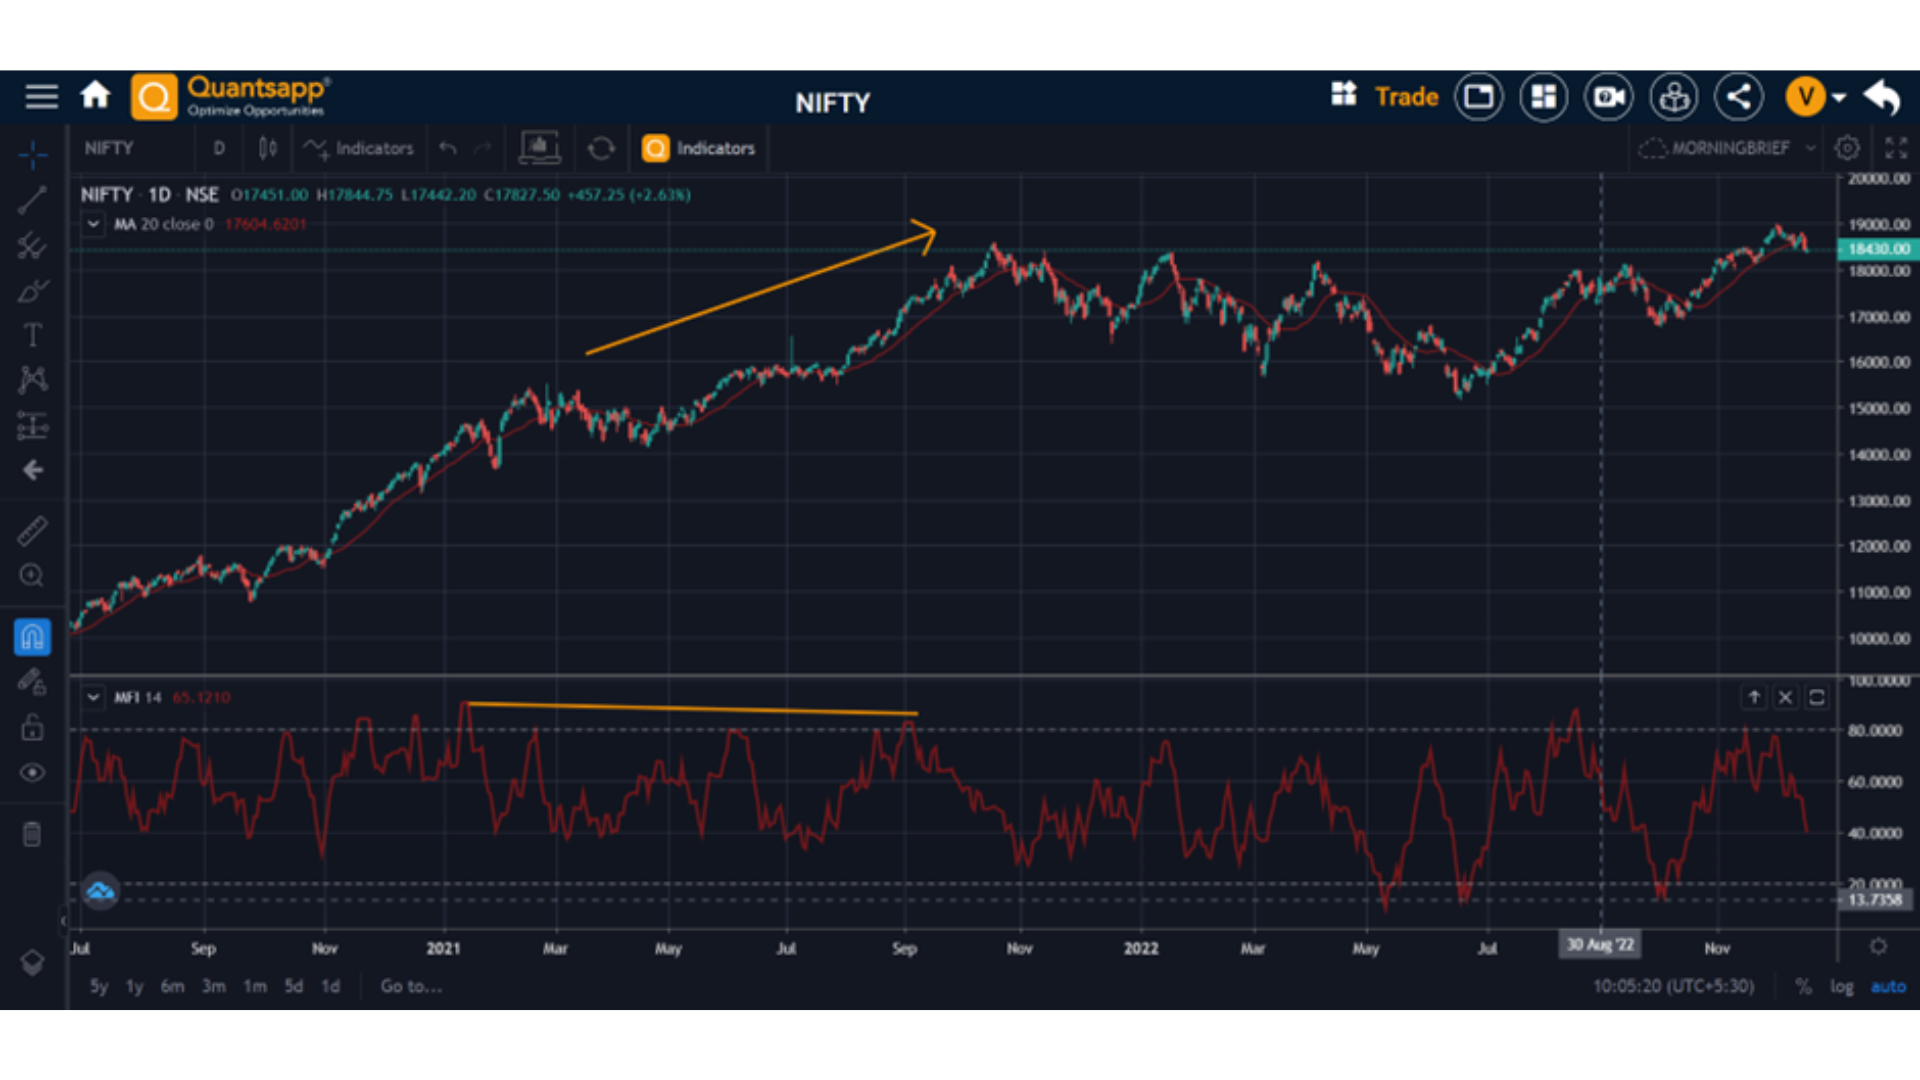
Its real time order and trade book giving perspective about market mood, sudden spurts in buying emanating in specific scrips.

Real time Order and Trade Analytics can be used for Intraday Trades.

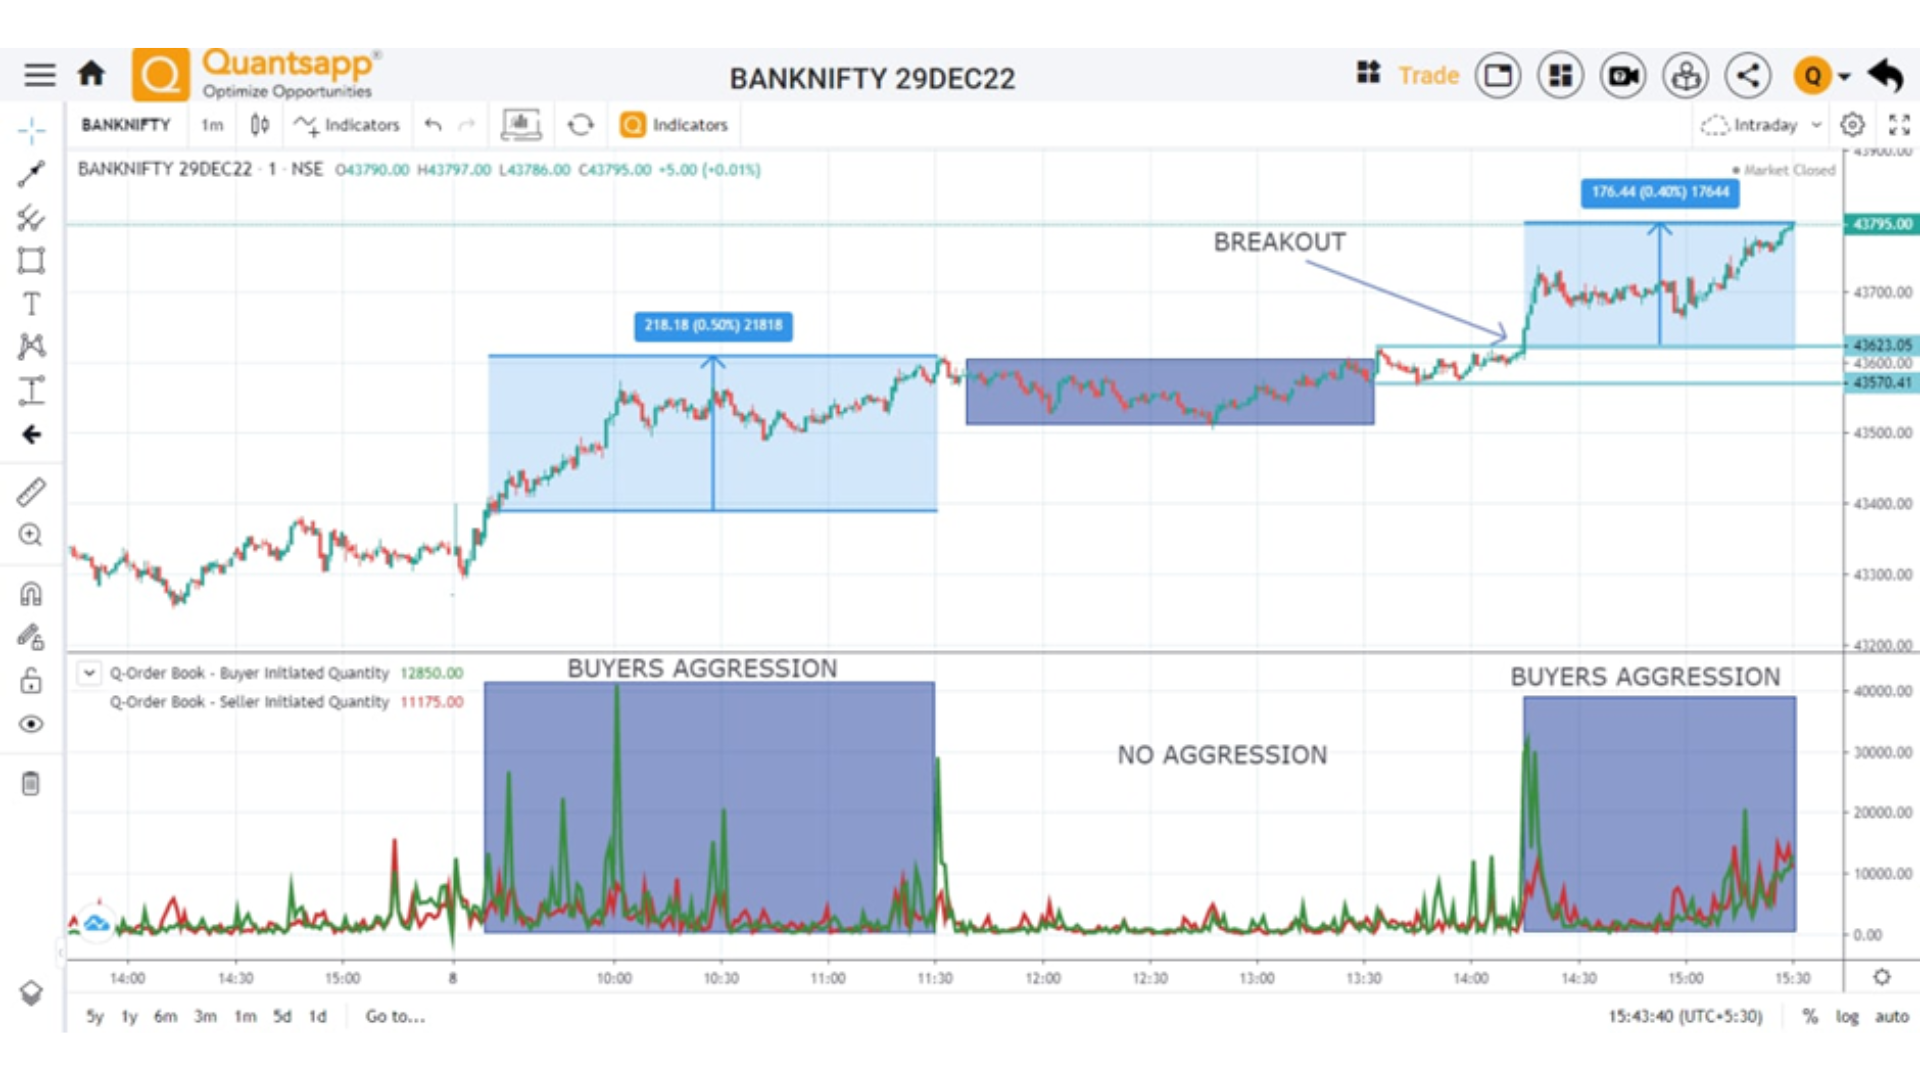
Cancelled to New Order Quantity help gauge if Buyers are faking or the break out is a real one.

There are 30+ such indicators which can be used to decipher better.

Orders – Indicates the orders received for the specified time period, eg: total orders within a minute

Orders Quantity – Indicates the quantity of orders received for the specified timeframe, eg: total order quantity within a minute

Buy Orders – Indicates the “Buy orders” received for the specified timeframe

Buy Orders Quantity – Indicates the “Buy order” quantity received for the specified timeframe

Sell Orders – Indicates the “Sell orders” received for the specified timeframe

Sell Orders Quantity – Indicates the “Sell order” quantity received for the specified timeframe

Order Book related Indicators

    • Order Book - Buyer initiated count – Indicates number of orders at sellers/offer/ask price, an increasing number indicates that more trades are possibly happening from the buyers’ end, indicating aggressiveness of the buyers as compared to sellers.
    • Order Book - Buyer initiated quantity – Indicates quantity of shares that were placed as orders at the sellers/ask price, an increasing quantity indicates more number of participants are eager to buy at the ask price, suggestive of a possible bullish mood.
    • Order Book - Seller initiated count – Indicates number of orders at buyers/bid price, an increasing number would indicate sellers are more aggressive than buyers
    • Order Book -Seller initiated quantity – Indicates quantity of orders that were present at a buyers/bid price, an increasing quantity would indicate more number of market participants are eager to sell at a price as requested by buyers, i.e. bid price.
    • Order Book -Seller initiated average quantity– Indicates the average quantity of trades for “seller-initiated trades
    • Order Book - Ratio Buyer to Seller initiated count – A ratio of “buyer-initiated count / seller-initiated count”; above 1 indicates that buyer-initiated trades are more than seller for the given time period.
    • Order Book - Ratio Buyer to Seller initiated quantity – A ratio of “buyer-initiated quantity / seller-initiated quantity”, a value above 1 indicates that buyer-initiated quantity of orders are more than sellers for a given time period, suggestive of buyers aggressiveness.

How to use the order book data for trade ideas?

The approach to use the order book data indicators have been to follow the aggressive moves, on a 1 min chart or 5 min chart.

The money flow index has characteristics similar to RSI oscillator, as discussed earlier. The chart above shows Nifty on daily time frame, with a positive divergence, implying prices head lower, while MFI moves higher, as shown with the lines on corresponding data sets. The divergences are of typically two types, the above chart shows a positive divergence, suggestive of a positive price action in coming days.

Seller dominant move in Nifty was observed after a consolidation, from 11:30 AM. Nifty Dec Fut was sold aggressively on the BID Price which led to a 50 pts slip in Nifty.  Date: 2 Dec 22. (Note: Buyer initiated Quantity is mentioned as a Blue Line, while Seller Initiated Quantity is mentioned as a Red Line).

BankNifty saw consistent buying on the ASK Price in the opening hour (200pts up move), post that there was a halt. Again at 14:15 Bank Nifty broke its day high & buyers dominated in this breakout which led to 170pts up move in the last 45 Mins. Date: 9 Dec 22.

From 10:52 HDFCBANK Futures were bought vigorously on the ASK Price v/s fewer quantities sold on the BID that led to almost 4.94% up move.

Dated: 11 Nov 2022 , time: 10:52.

Now the options of the same underlying, at the same juncture:

From 10:52 HDFCBANK 1540CE  were bought vigorously on the ASK Price v/s fewer quantities sold on the BID that led to almost Rs 28 to Rs 100 move in call option. Dated: 11 Nov 2022 , time: 10:52.

Fake Breakouts - Identification

Consider the above 1-minute chart on Nifty on 29 Nov 2022. By observing the right most candle, which is a bull candle, substantiated with good volumes, is suggestive of a break out scenario in Nifty.

Now we realise that during that juncture, Seller Initiated Quantity was much larger than buyer Initiated Quantity. This makes us believe that we should consider this as a assured breakout and could be a “Fake” break out. The next chart shows the end result.

These bouquet of Order and Trade Analytics clearly, help at different junctures to ascertain the sanctity of price break outs and will they be sustained.

FAQs

What is an Order Book and a Trade Book?

The order book is the term to describe the entire list of orders present in the system for a particular financial instrument. When an order gets executed, it is termed as a trade. The book corresponding to the trades is called a trade book, which is a list of trades that have been executed on the exchange platform.

How do you keep track of aggressive and high frequency trades?Does implied volatility predict realized volatility?

Quantsapp allows users/subscribers to access Prop./Institution Level Data for

Retail Traders, with above 33 indicators to enable option traders to develop an edge in their trading. Buyer Initiated Quantity (BIQ) and Seller Initiated Quantity (SIQ) are trade book indicators which help in knowing whether there is aggressive buying on the ASK price or aggressive selling on the BID price.

How to distinguish fake breakouts from genuine one?

Quantsapp order and trade analytics helps in distinguishing fake breakouts from genuine one by visualising, if the breakout was supported by New Orders or Not?? Or is there a large seller who is selling despite the break out (which can be tracked from SIQ), indicating that the breakout might fade away.