Implied volatility is an attribute that is given to any unexplained price change of option premium after passage of stipulated time and stipulated move. Let’s take an example to understand it.
Ideas
Ideas
.svg)
Intel Junction
Trade
Trade
Orders API
Watchlist
Orders
Positions
Broker Access
Hot Keys
Alert Trigger Order (ATO)
Bracket Order
Target Stoploss Order
Add Broker
Track
Futures OI
Options OI
News
Price & Volume
Alerts
Built-Up Breadth
Built-Up Scrip Symbol
Synopsis Futures OI
Built-Up Sectors
Top Stocks
Intraday Movers
Analyze
Charts
IV
PCR
Expiry
Price & Volume
Charts/ Order & Trade
Multi Strike OI
O&T Watch List
Strategy Chart
Scan
Hist-Futures
Hist-Options
Pairs
Built-Up Scrip OI-Historical
Built-Up Sector Cycle
Built-Up Sector OI-Historical
Built-Up Scrip Cycle
Comparative Analysis
Tools
Easy Strategy
Strategy Builder
Quant Models
Essential Tools
Optimizer Find Strategy
Optimizer Find Specific
Optimizer My Forecasts
Optimizer Constrains
Learn
Live
Self Learning
Events
Webinars

Book a Session


Chapter 2
What is Implied Volatility?

Let’s assume:
-
-
-
- Nifty is expected to move from 18500 to 18600 in 2 days, while ideally it is assumed option premium should move from 110 to 150.
- However, does this move really materialise? No!
- Instead, one could witness a gyration possibly from 110 to 160, which implies that the extra Rs 10 increase is due to rise in implied volatility.
- Similarly, one could witness a gyration of Nifty option premium from Rs 110 to Rs 145, which implies that there was a deficit of about Rs 5 from the ideal case. This suggests there has been a drop in implied volatility of the option under study.
-
-
Calculation of implied volatility
Implied volatility is calculated from the market price of options, using the Black Scholes option pricing model. This is the volatility input, which causes the option pricing model to give out the ideal price of the option, which matches the market price of the options.
Black Scholes Option pricing model is dependent on the following:
-
-
-
- Underlying Price.
- Strike Price
- The time to expiration
- Volatility
- Risk-free interest rate
-
-
Implied volatility is calculated by taking the market price of the option, plugging it into the Black-Scholes formula, and solving iteratively for the matching volatility (i.e. implied volatility). Thus Volatility Implied by Options Premium is called Implied Volatility.
Option calculator is a tool of Quantsapp which helps option traders to observe the implied volatility figure from the market price of options of underlying like Nifty or other NSE F&O stocks.
Implied volatility of NIFTY 18450 1Dec2022 CE has been calculated using Quantsapp calculator.
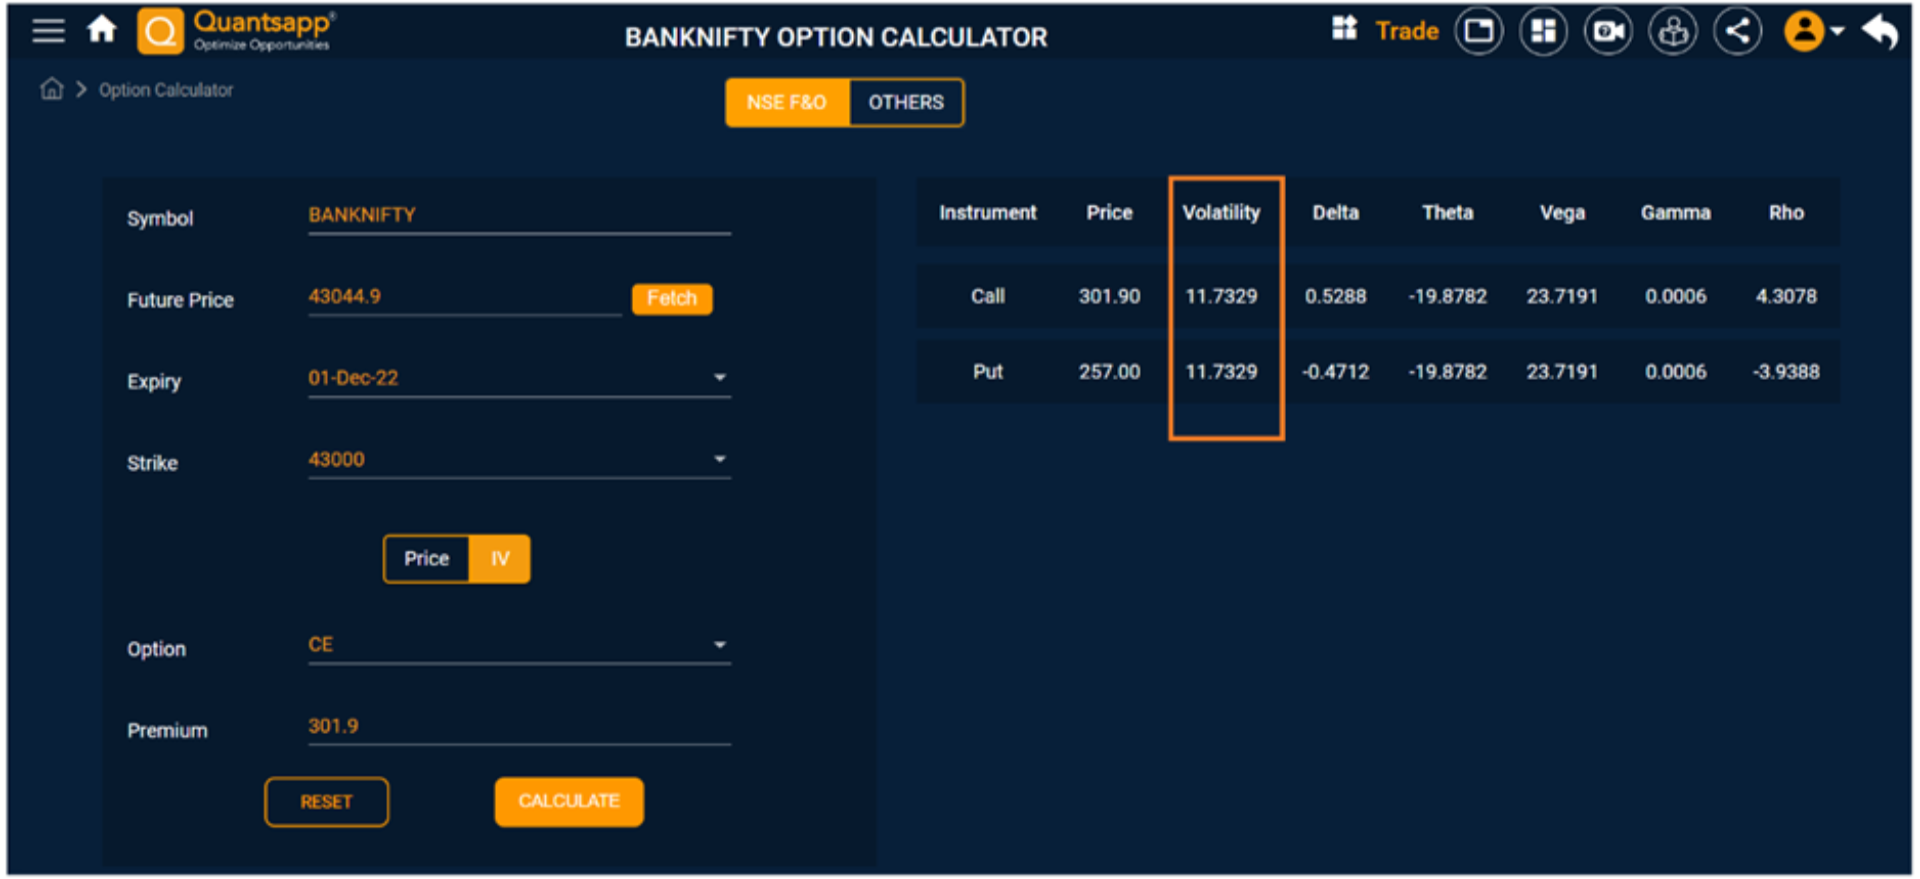
Implied volatility of BANKNIFTY 43000 1Dec2022 CE has been calculated using Quantsapp calculator. Option Greeks are also computed, which shall be discussed later.
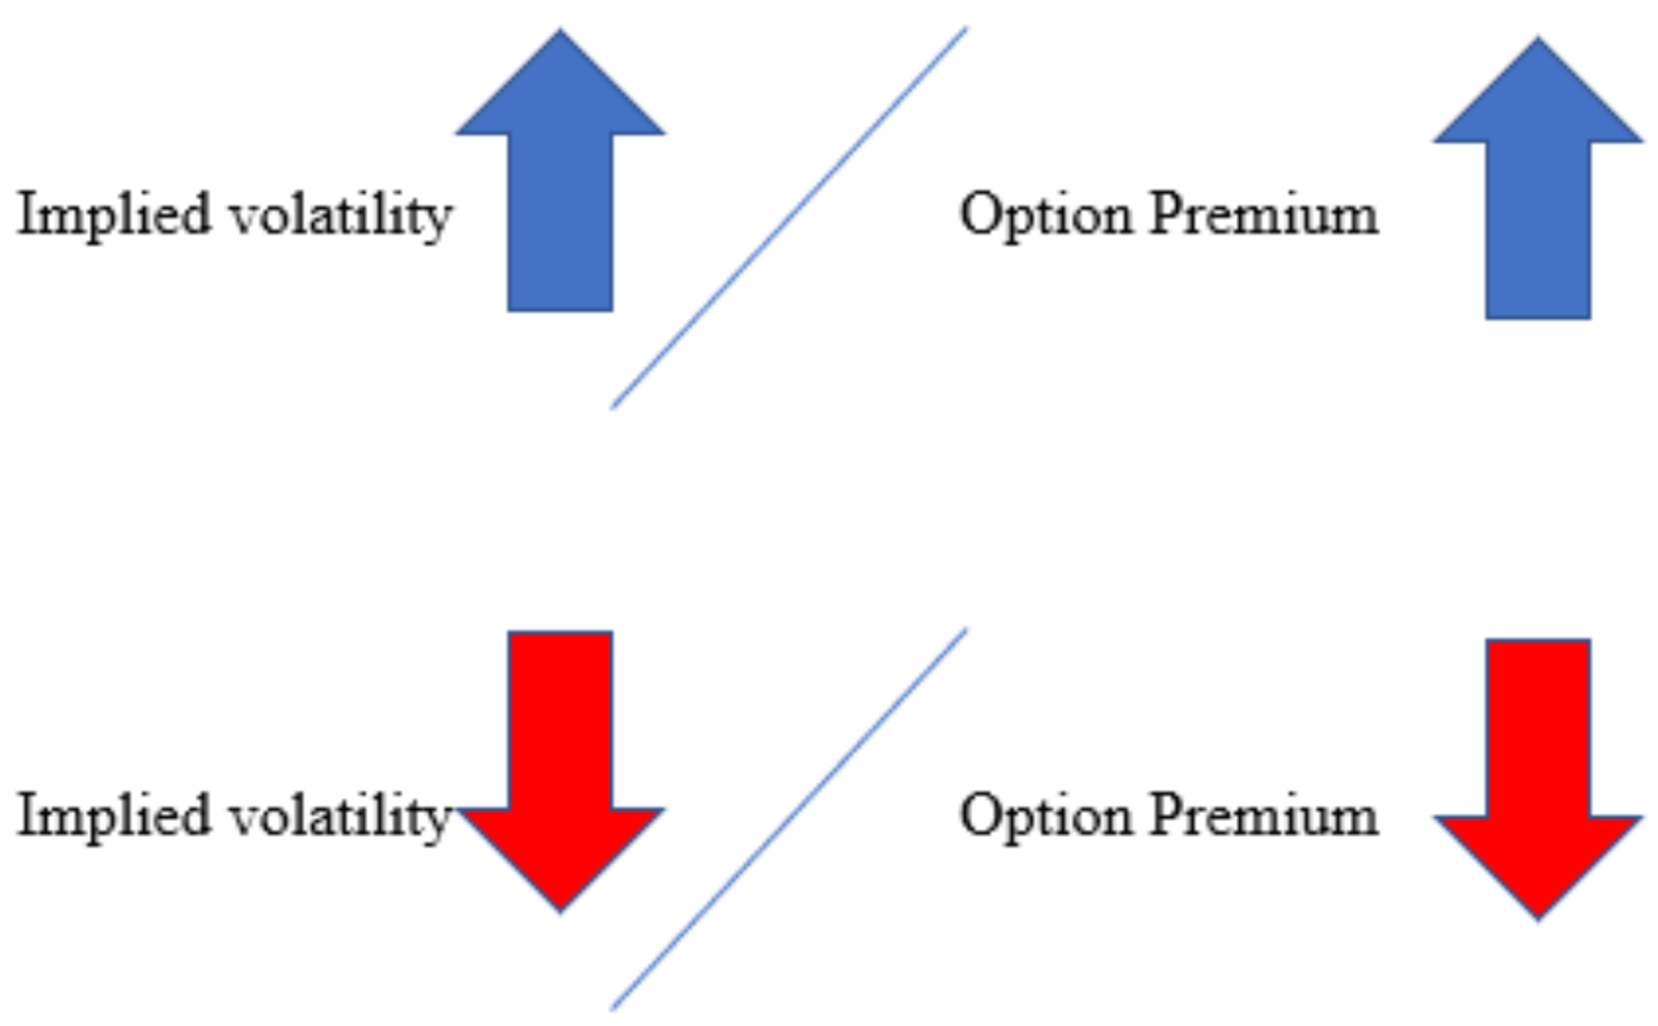
Relationship of Implied Volatility and option premium
Implied volatility is a measure of uncertainty, which means as uncertainty of an underlying increases, the tendency of traders, fund managers to mitigate their risk/uncertainty would buy options, resulting in increased demand for those options, resulting in a skew in supply/demand situation for the financial instrument under purview. The rise in implied volatility occurs in a symbiotic manner with the increase in option premium. So, options with high levels of implied volatility will result in high-priced option premiums as compared to the same options if the implied volatility was lower.
Relationship of Implied Volatility and option premium
Implied volatility, generally, traders do believe in quotation in and around realised volatility. Then, why and what is the difference between realised a. k. a. historical and implied volatility?
Volatility figure, which is an input in the option calculator that gives rise to prevailing market price of the option expected volatility and not historical volatility (which has gone by). It is option traders’ expectation of upcoming volatility.
As a result, we witness that the expectation of volatility or implied volatility is different for the same stock with different expiries, different option types and different strikes as well.
What do we attribute this difference between the two volatilities to?
Implied volatility = Historical volatility + volatility Risk premium
Let’s consider scenarios which help in understanding varied volatility risk premia. Is the risk going to be higher or lower in coming days?
Scenario 1:
Consider the results of the stock or underlying is about to be released in a couple of days, expected risk premium builds up on uncertainty about results, which could result in sharp moves/price gyrations (fireworks) in the underlying. So implied volatility jumps to about 30%, higher than historical volatility which at that juncture is 10% only.
Implied volatility (30%) = historical volatility (10%) + volatility risk premium (20%)
Scenario 2:
Consider the results of the stock have gone by, now the uncertainty is out of the window. The risk is expected to degrow, so we witness degrowth in implied volatility which is option traders’ perspective of expected volatility, which will drop, due to aforementioned reasons. Volatility risk premium drops, as implied volatility drops to 10%, post result announcement, as traders expect a lull now. However, the recent turbulent times gone by will keep the historical volatility high.
Implied volatility (10%) = historical volatility (30%) + volatility risk premium (-20%)
Some real life examples:
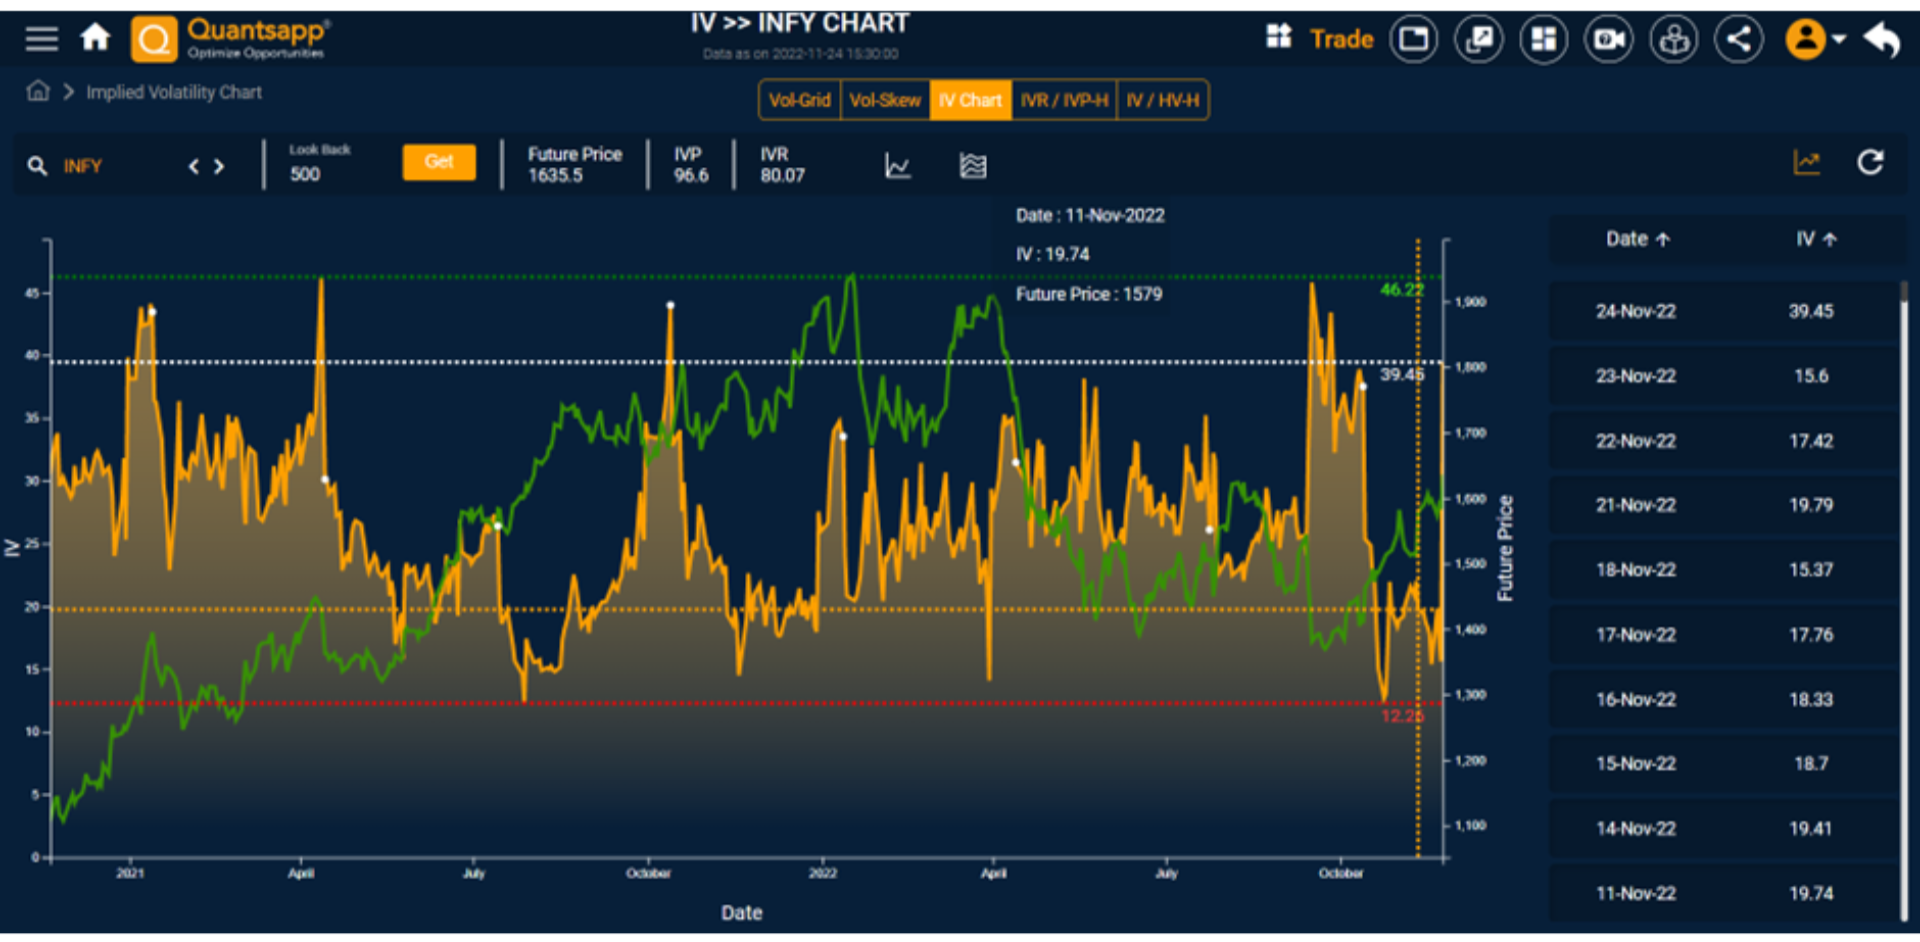
Chart of Infosys Implied Volatility (IV), with white spots indicate Result announcement dates. (Note the spike before result and dissipation after result announcements).
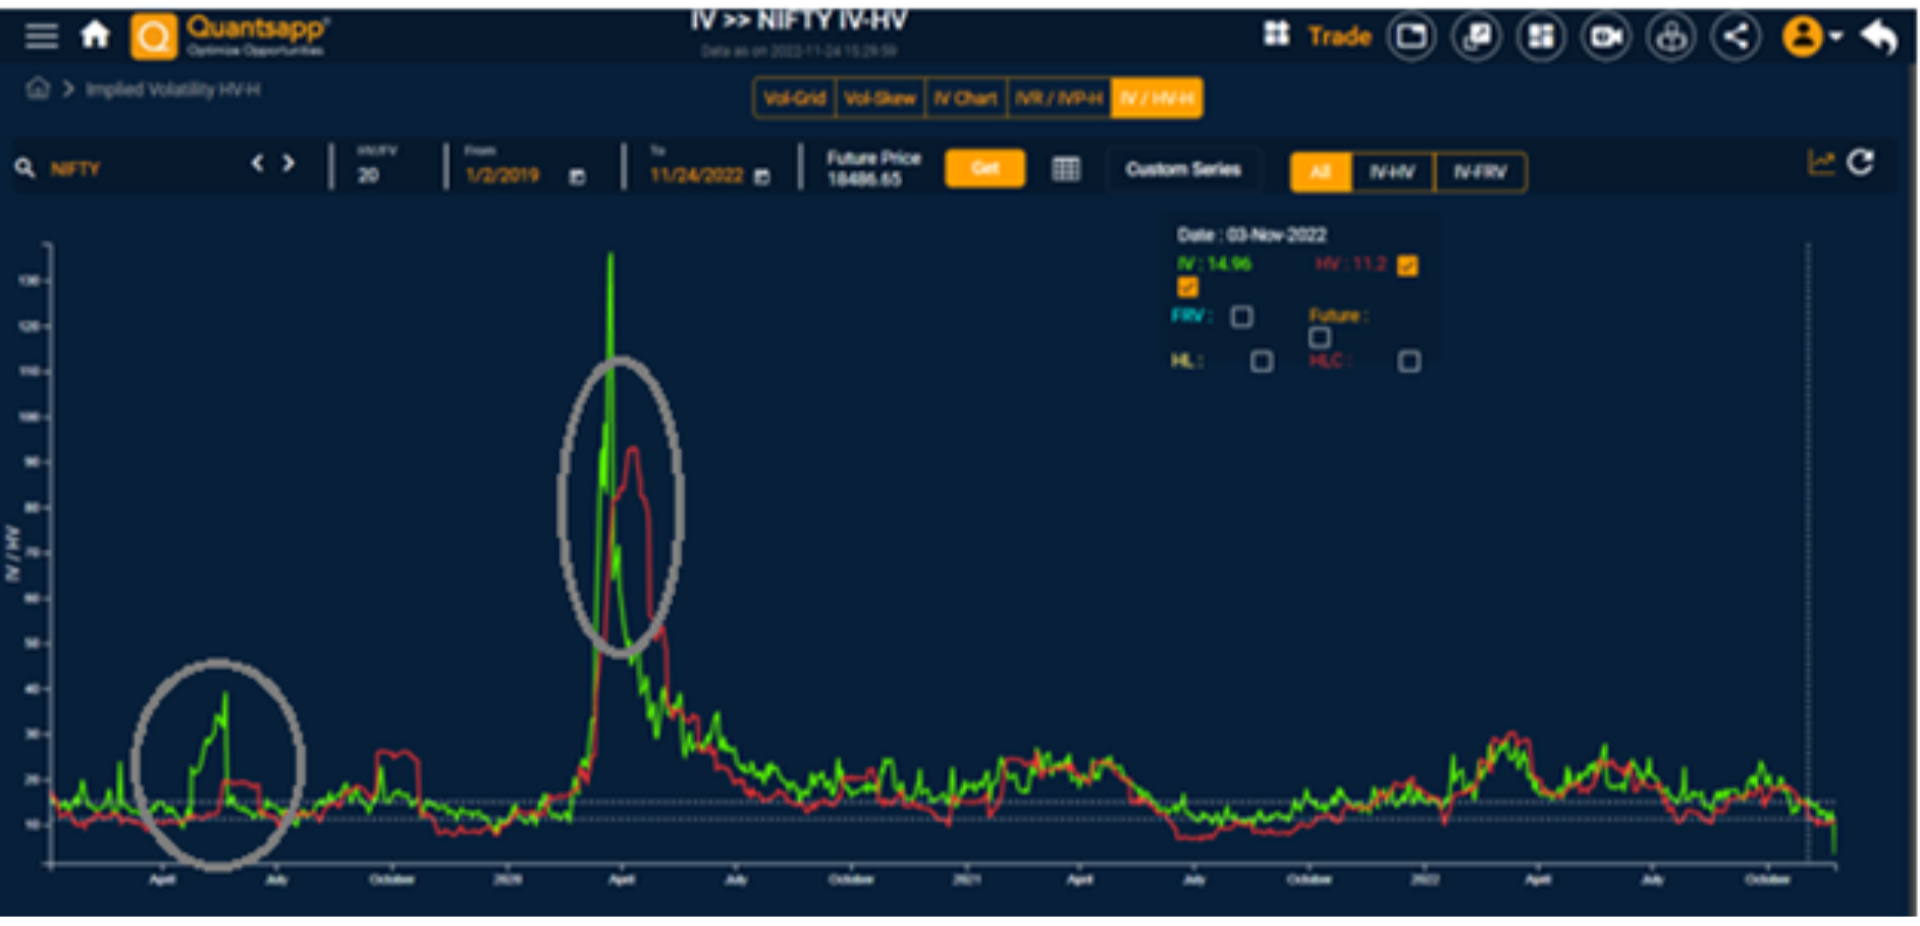
Chart of Nifty Implied Volatility (IV) and Historical Volatility (HV). Note how in 2 major highlighted situations Implied Volatility rose first then dropped while Historical volatility rose later and dropped later.
FAQs
Why Is Implied Volatility Important?
Implied volatility is the market participants’ option-based volatility measure; in other words, it is market’s forecast of volatility of an underlying like Nifty, Bank Nifty and F&O stocks.
How Is Implied Volatility Computed?
Implied volatility is calculated from the market price of options, using the Black Scholes option pricing model.
What is the difference between VIX and implied volatility?
VIX is a volatility index, while implied volatility is market’s perception of volatility for a stock as an underlying.
Where can you find implied volatility of options?
Implied volatility is calculated from the market price of options, using the Black-Scholes option pricing model. Implied volatility for each F&O stock and Nifty/Bank Nifty can be easily observed in graphical as well as numerical form in Quantsapp’s IV suite.