Mean reversion is a phenomenon where, if a data point is far from the historical average values, then the tendency of the next data point is, to be nearer to the average value. In other words, when a particular instance in a mean-reverting data series is an outlier, the next data point has lower probability of being above the outlier, but its highly probable that it would be contained between the outlier and the historical mean. Also, there exists a strong tendency in place, for this data series to gradually gravitate towards the historical mean. It is also known as regression to the mean.
Ideas
Ideas
.svg)
Intel Junction
Trade
Trade
Orders API
Watchlist
Orders
Positions
Broker Access
Hot Keys
Alert Trigger Order (ATO)
Bracket Order
Target Stoploss Order
Add Broker
Track
Futures OI
Options OI
News
Price & Volume
Alerts
Built-Up Breadth
Built-Up Scrip Symbol
Synopsis Futures OI
Built-Up Sectors
Top Stocks
Intraday Movers
Analyze
Charts
IV
PCR
Expiry
Price & Volume
Charts/ Order & Trade
Multi Strike OI
O&T Watch List
Strategy Chart
Scan
Hist-Futures
Hist-Options
Pairs
Built-Up Scrip OI-Historical
Built-Up Sector Cycle
Built-Up Sector OI-Historical
Built-Up Scrip Cycle
Comparative Analysis
Tools
Easy Strategy
Strategy Builder
Quant Models
Essential Tools
Optimizer Find Strategy
Optimizer Find Specific
Optimizer My Forecasts
Optimizer Constrains
Learn
Live
Self Learning
Events
Webinars

Book a Session


Chapter 4
Volatility and Mean Reversion

What is mean reversion?
Is Volatility, a mean reverting data series?
Argument 1:
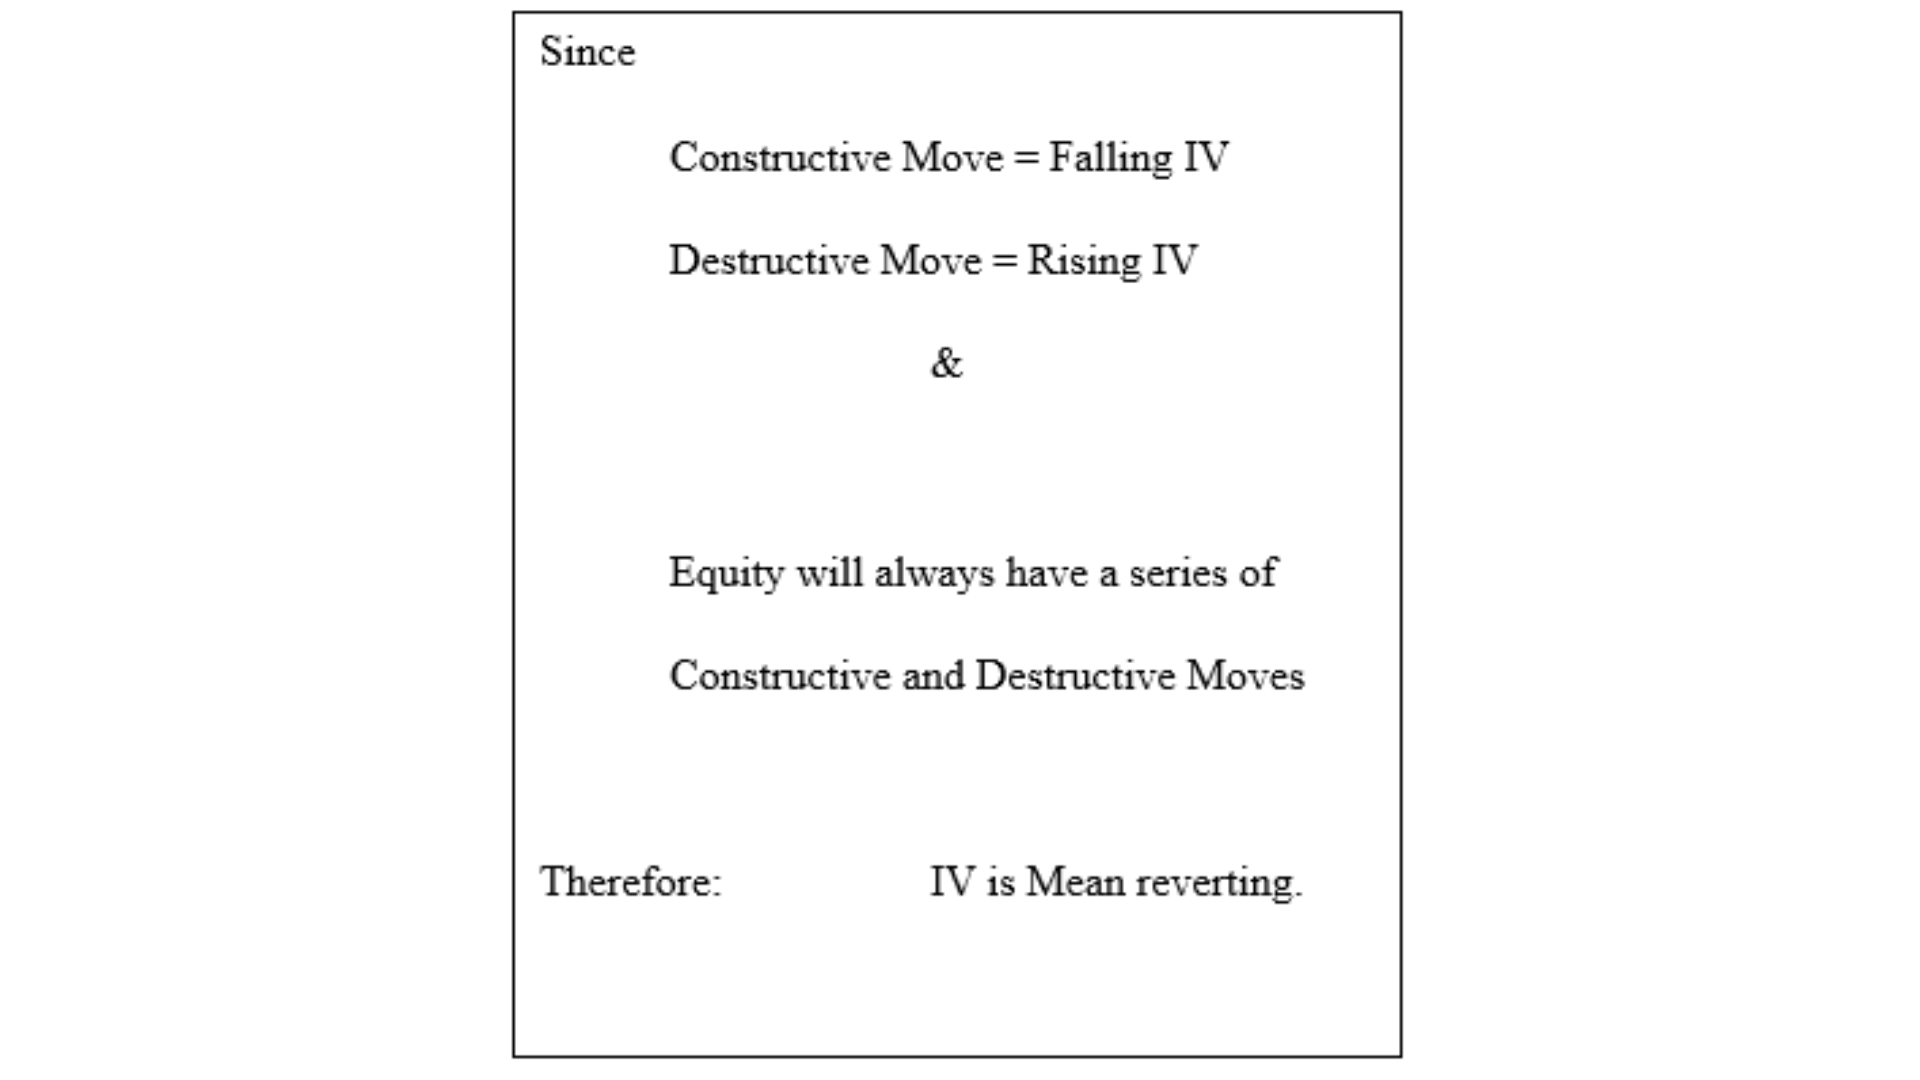
Greed and fear are factors that contribute to markets’ overall investing mentality or sentiment, influenced by behavioural biases. These states of mind trigger periodic “risk-on” and ``risk-off,” in other words boom and bust cycles in financial markets or as we put forth, the constructive and destructive cycles. The destructive cycles are fast and furious in nature, while as they say, it takes time to mend the souls! So, the constructive cycles are slower and steadier in nature. So, the scale of changes in prices during a fixed time window during the cycles is called volatility, measured using a statistic called standard deviation. The constructive move in the markets, coincide with falling volatility, while destructive move in the markets, coincides with rising volatility.
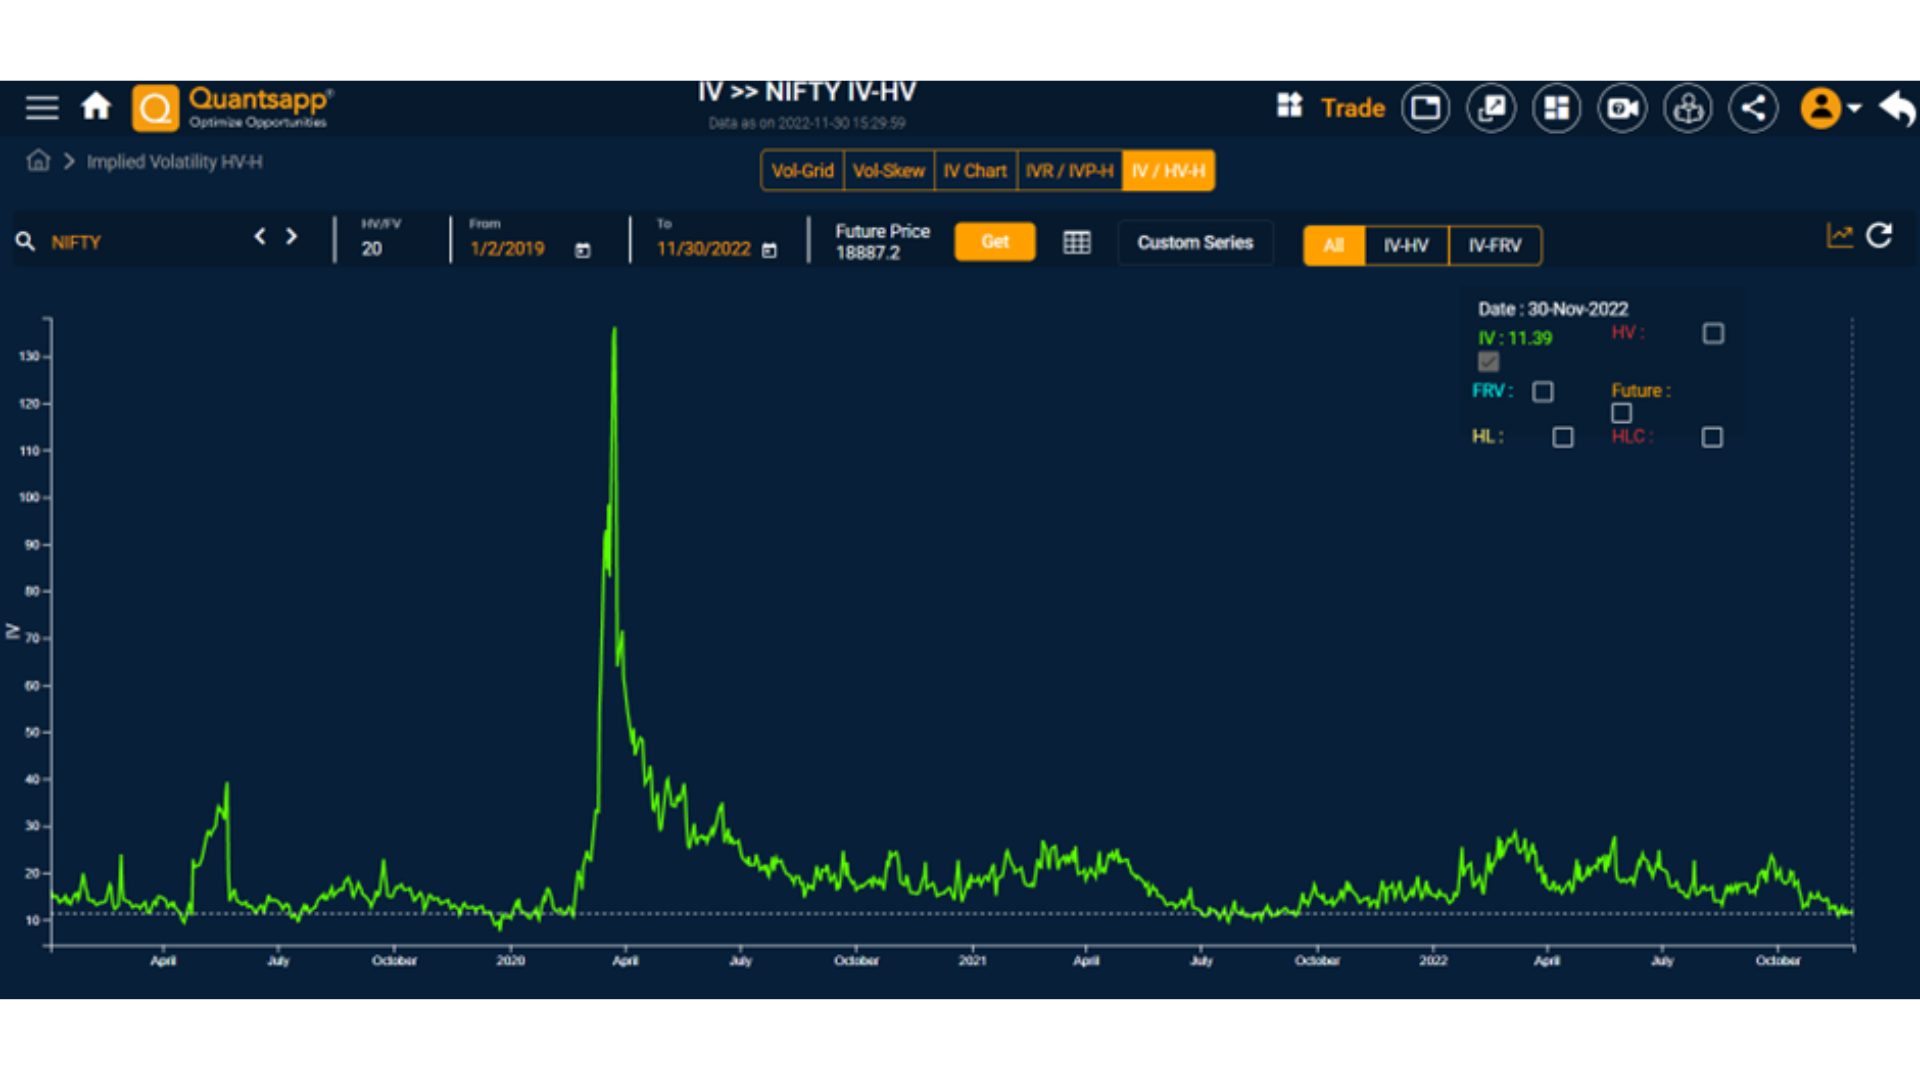
The chart above indicates that there was a COVID related implied volatility spike in Nifty, which was pacified and later implied volatility shrunk to its stipulated range, as evident from the green line above.
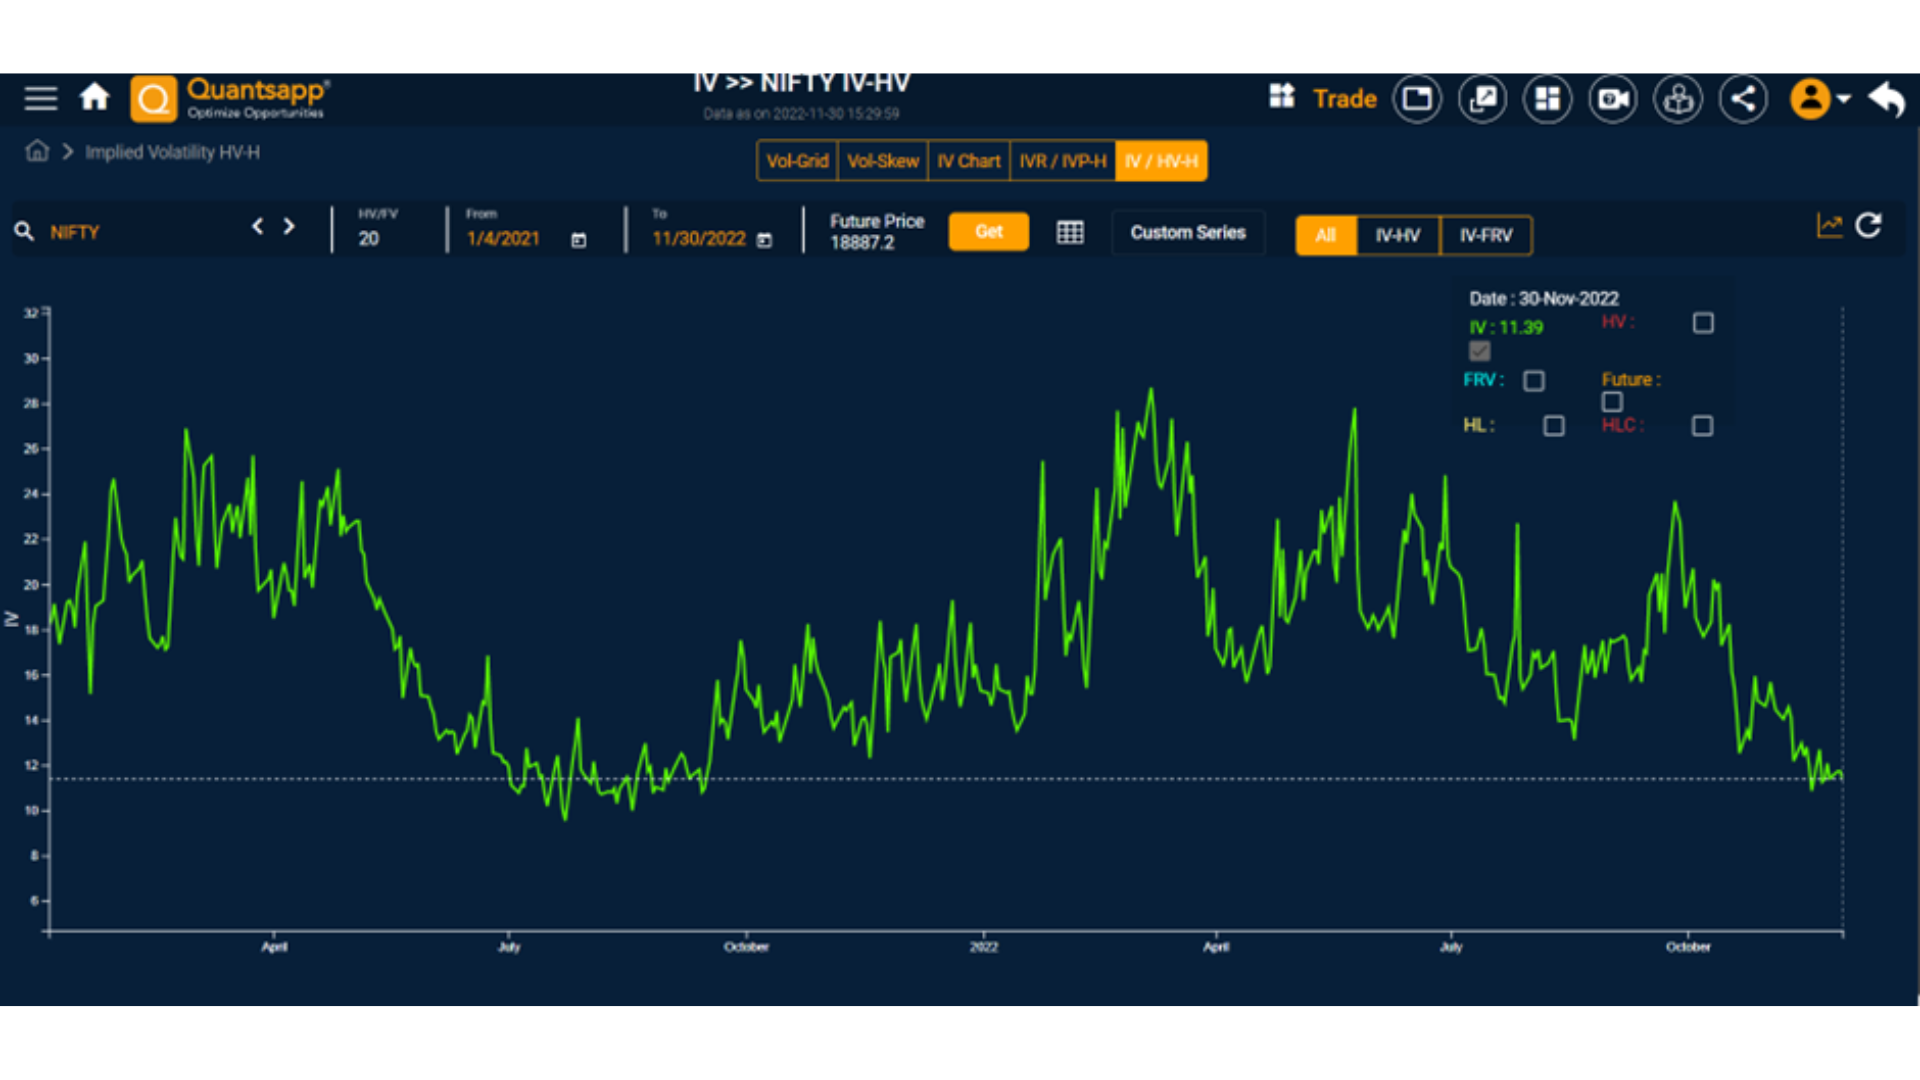
The IV chart above (Jan 2021 – Nov 2022) in Nifty exhibits cyclical nature of implied volatility, where it moves towards extremes and then tends to revert back to a central value. The implied volatility doesn’t stay at too long at the extremes (higher or lower) and tends to transition to the middle value or central value often.
Argument 2:
There are no second thoughts that any stock or equity index like Nifty/Bank Nifty tends to follow a generalized path of highs and lows. In the constructive phase, prices tend to make higher-highs and higher-lows; while in the destructive phase or bear phase, prices tend to make lower-highs and lower-lows.
The Highs and Lows are way of life for equities, like Inhaling and Exhaling
So, human beings don’t keep on inhaling or keep on exhaling, similarly, equity prices, also keeps moving higher and lower in succession, to each other.
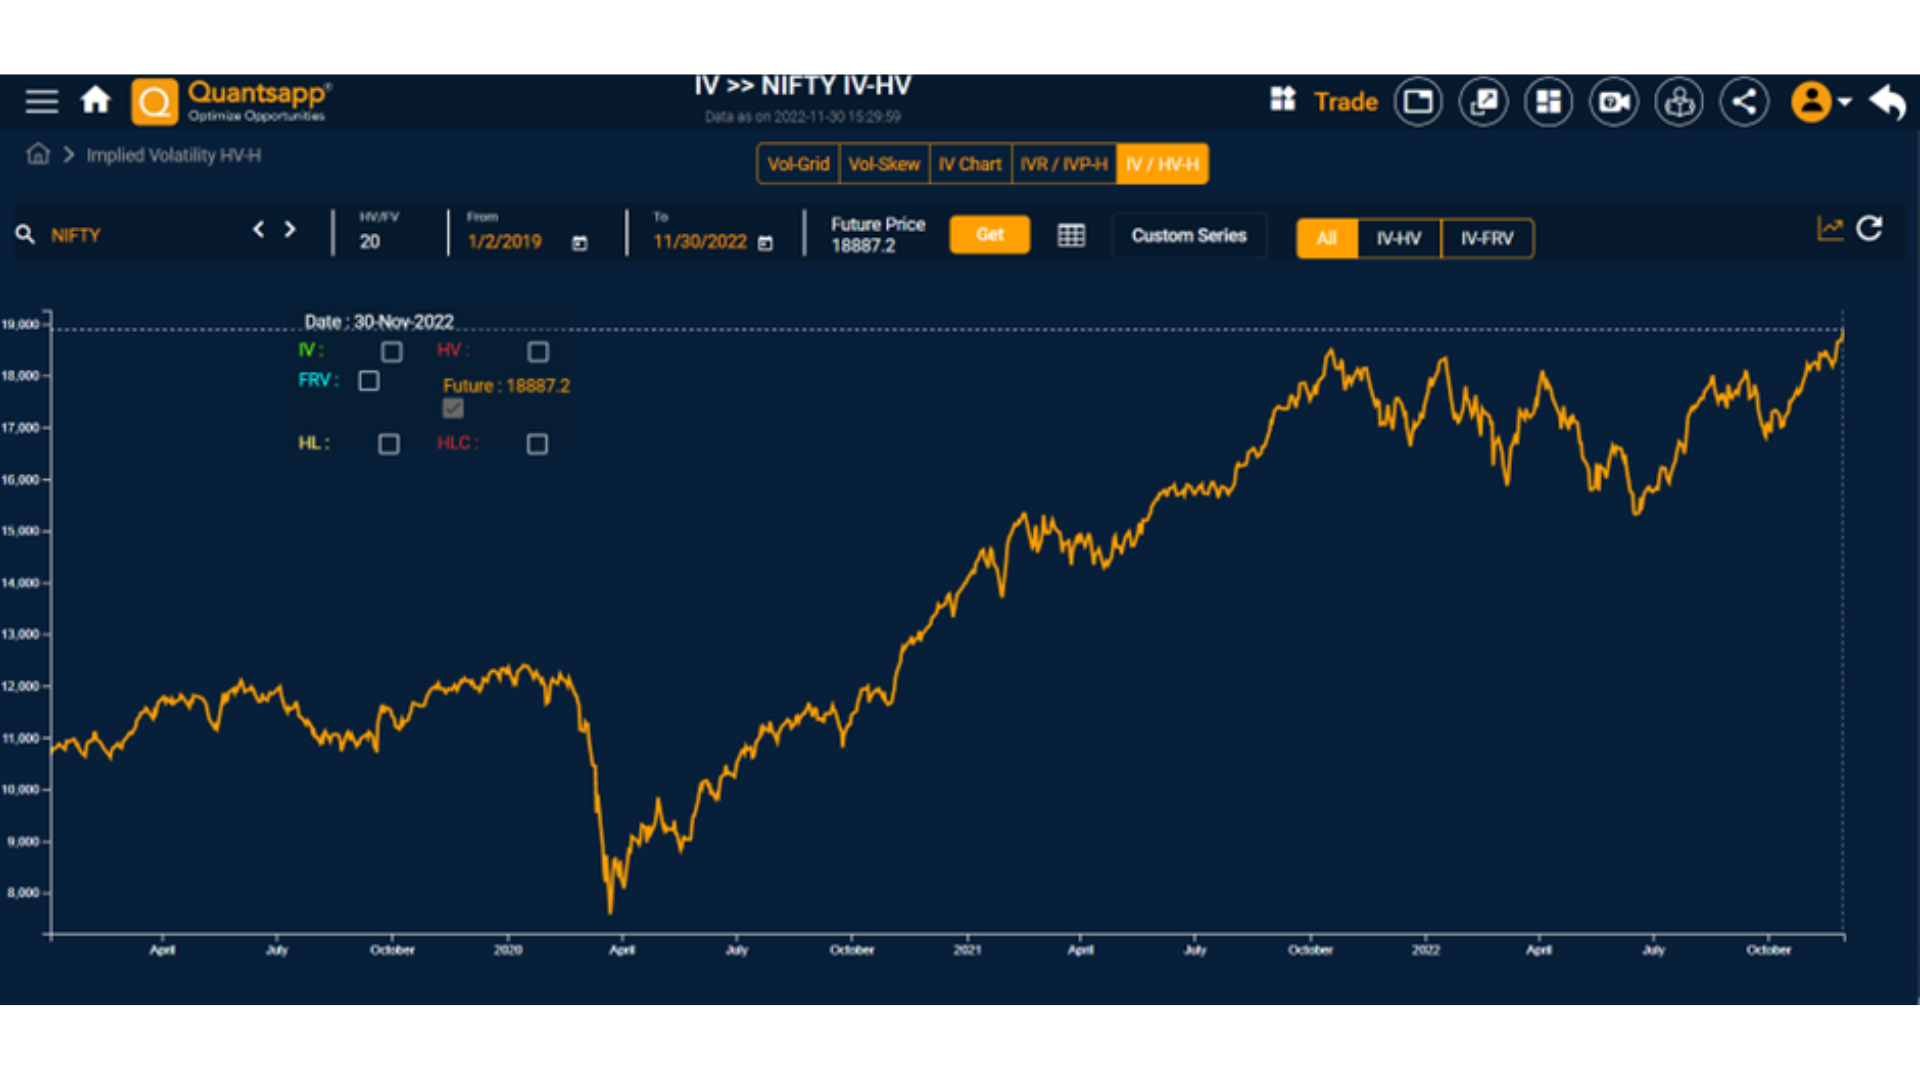
Chart of Nifty (Jan 19 – Nov 22) indicates the highs and lows made during the constructive move post COVID dip and also the characteristic of the furious dip during event risk, i.e. COVID-19.
Argument 2:
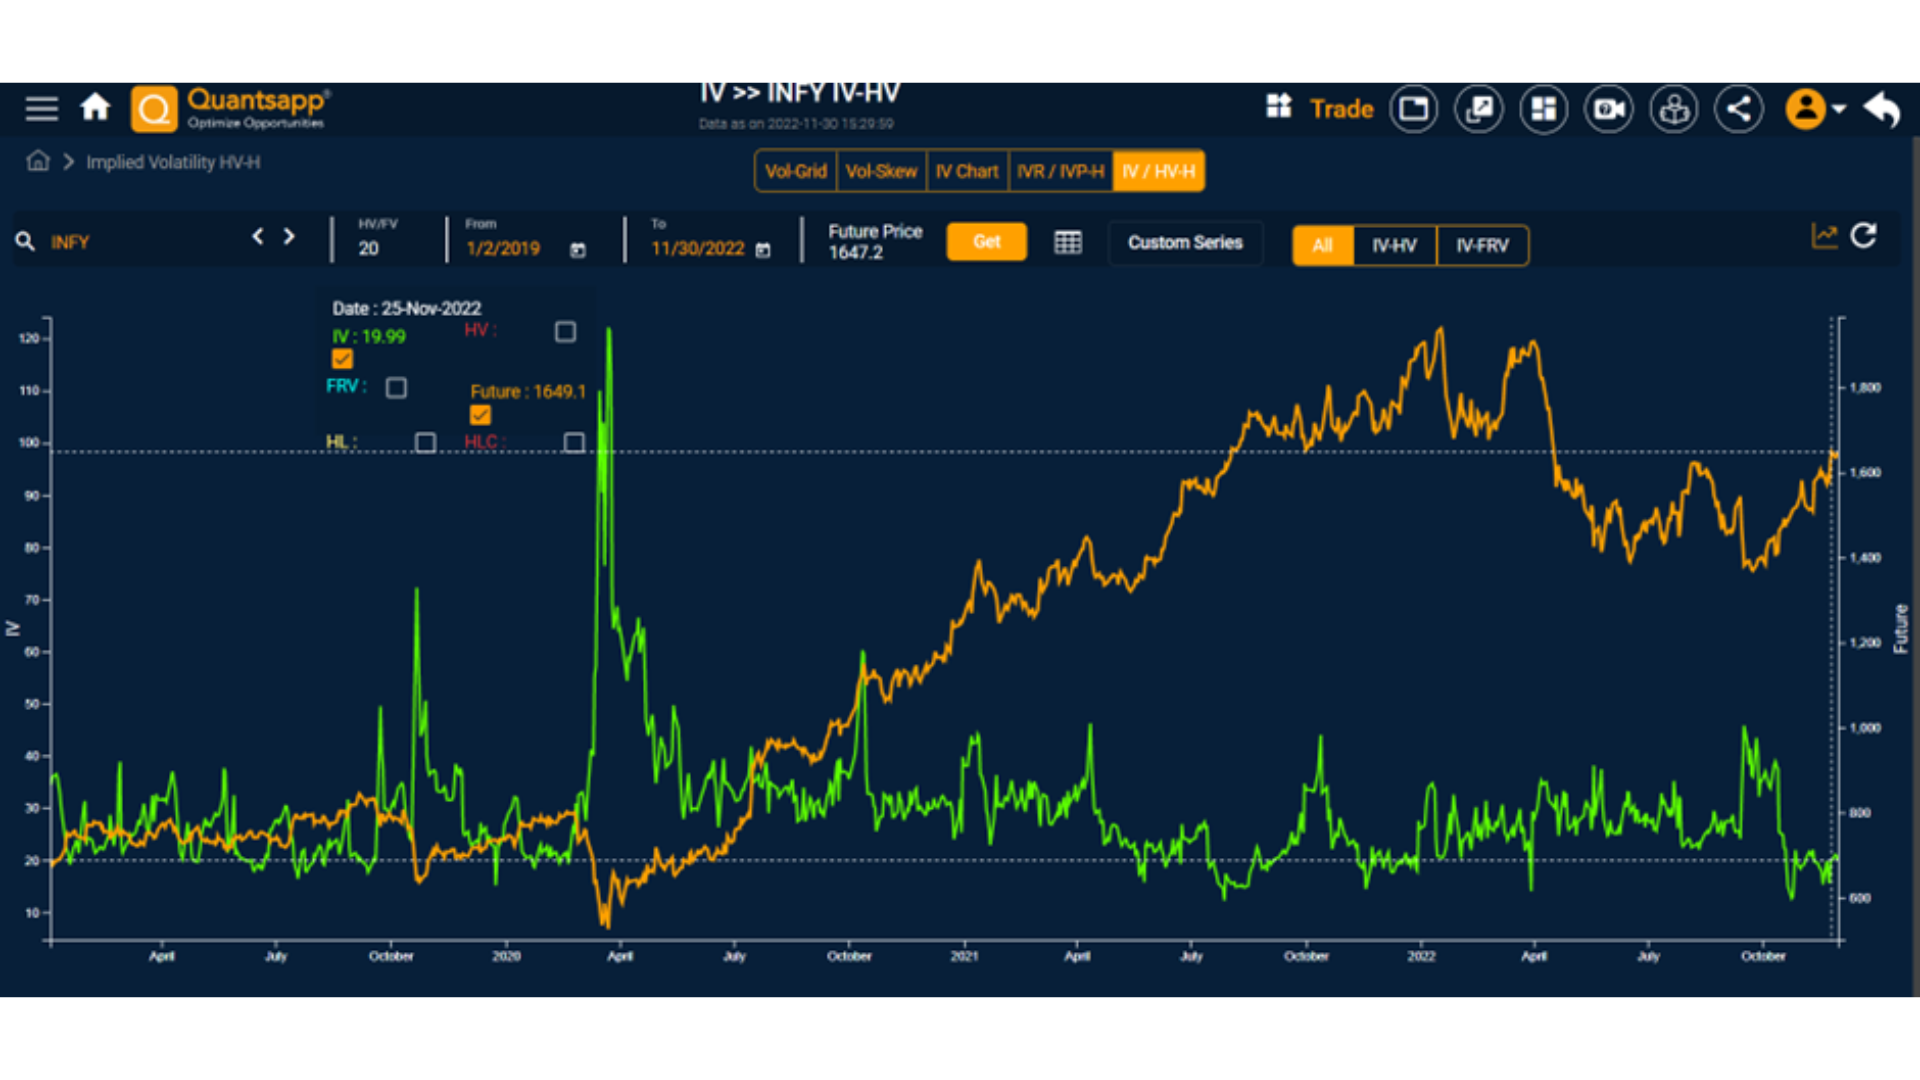
The above chart shows the behaviour of volatility and price action of Infosys (Jan 2019 to Nov 2022), where it is visible that COVID related spike in volatility coincides with drop in prices. Similarly, one can also observe, the rally in Infosys hasn’t been a one-way path, but with respective highs and lows in prices. Subdued volatility, on the other hand, has been a testament to the ongoing constructive move.
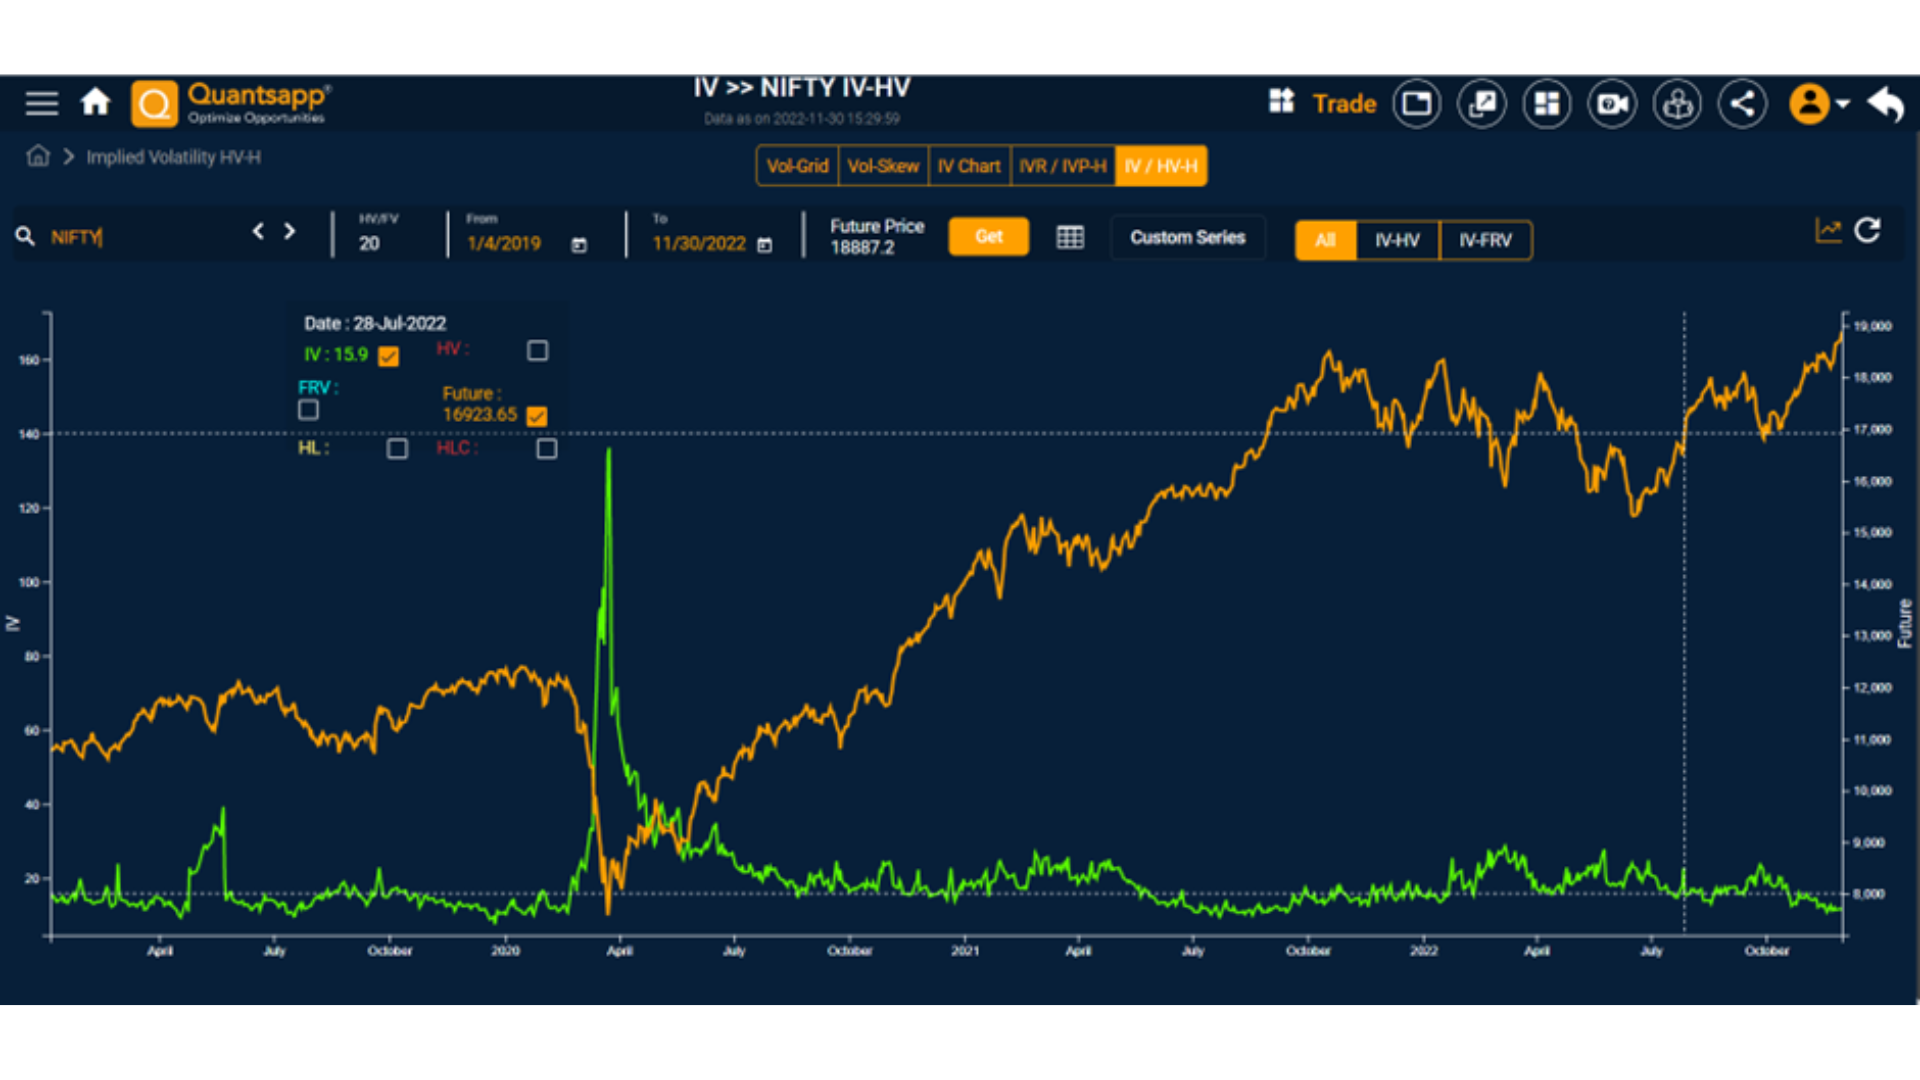
The above chart shows the behaviour of volatility and price action of Nifty (Jan 2019 to Nov 2022), where it is visible that COVID related spike in volatility, coincides with drop in the Nifty index. Similarly, one can also observe, the rally in Nifty hasn’t been a one-way path, but with having gyrations. Subdued volatility, on the other hand, has been a testament to the ongoing constructive move.
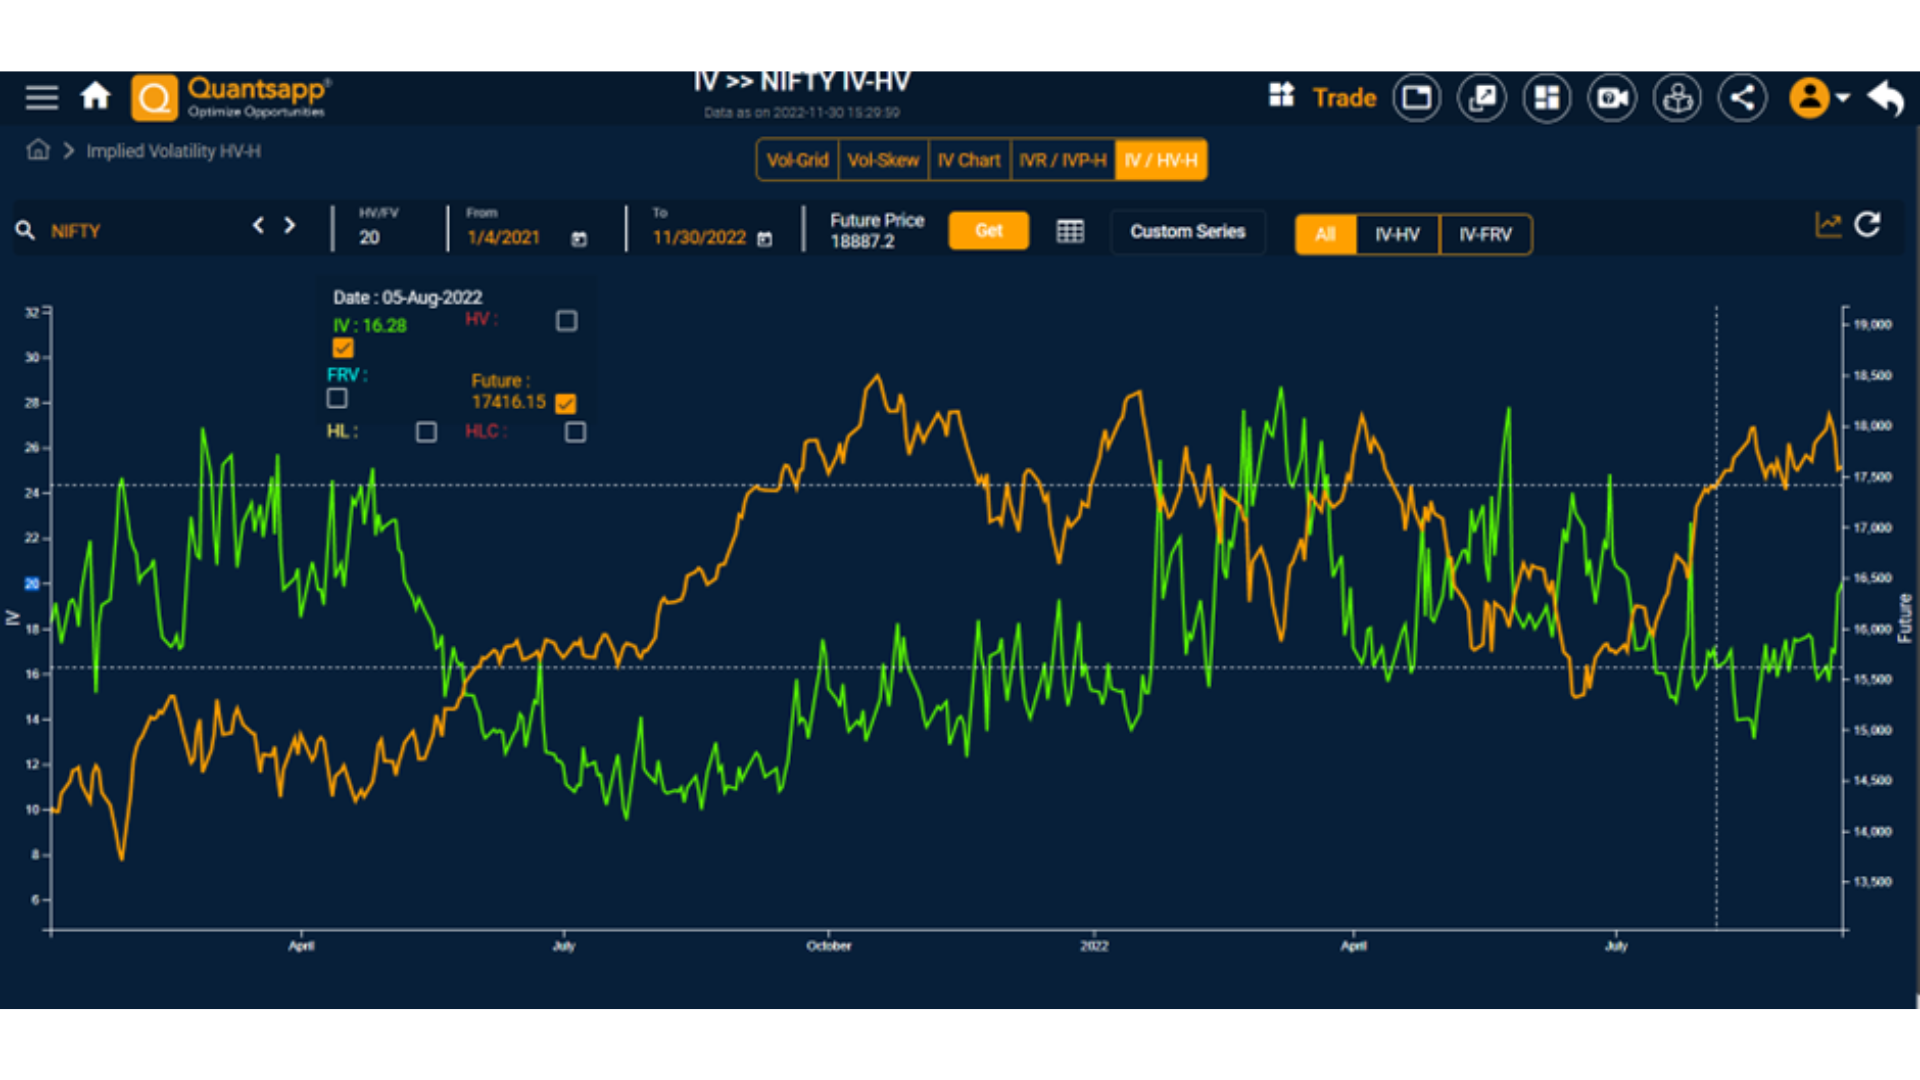
The similar studies have been found in Nifty on a short time frame (Jan 2021 – Nov 2022), constructive move in Nifty = drop in volatility
Any, destructive move in Nifty (bear move in prices) = rise in volatility
Money spinner
How can option traders exploit the mean reversion characteristic of volatility?
As volatility has mean reversion characteristic, a positive extreme can be used to short volatility and the negative extreme can be used to buy/long volatility; the extremes on either side would cause eventually the volatility to revert to the mean. At Quantsapp, Vol Trader is a tool, which can be used by option traders to detect when the short volatility signal, as it appears in the system, to sell options (straddles/strangles) and vice versa.
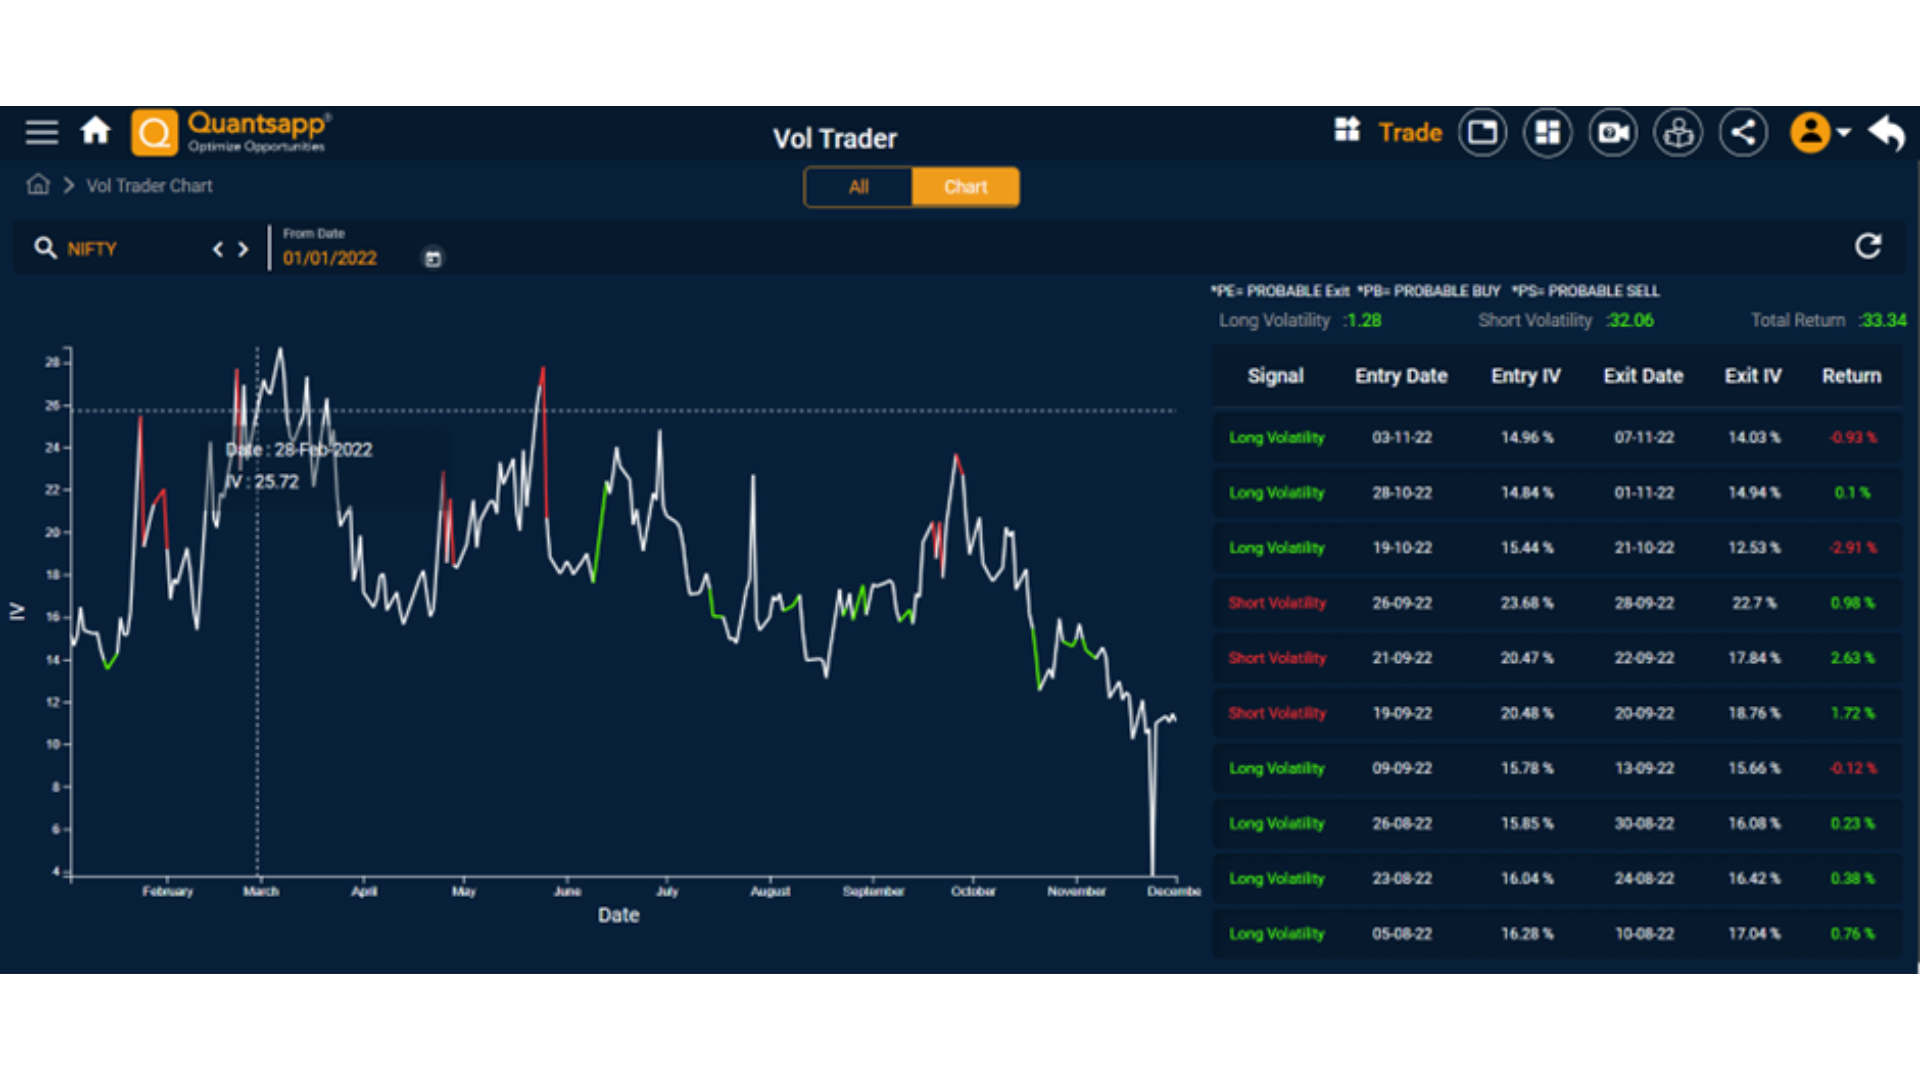
The above exhibit depicts the line chart of Nifty with red portions being the short volatility signals (with entry and exit) and the green portions indicating long volatility signals. The tabular representation of the respective signals generated and their returns in terms of volatility points is useful for option traders to develop a perspective.
FAQs
When does volatility increase?
Volatility spikes during an event risk or period of heightened uncertainty like war, COVID etc.
How volatility is measured?
Different types of volatility are measured in different ways.
Historical volatility is measured by calculating standard deviation of returns or prices of the underlying for a past look-back period.
While implied volatility is measured or calculated using market price of options, via the Black-Scholes Option pricing model.
How does volatility affect options?
A rising volatility results in higher option premia, while lower volatility suppresses option premia of the same underlying.
What is meant by mean reversion?
When volatility or any data series reaches one extreme, i.e. either higher or lower, its tendency is to move towards the historical mean. Also, there exists a strong tendency in place, for this data series to gradually gravitate towards the historical mean. It is also known as regression to the mean.