Login
Ideas
Ideas
.svg)
Intel Junction
Trade
Trade
Orders API
Watchlist
Orders
Positions
Broker Access
Hot Keys
Alert Trigger Order (ATO)
Bracket Order
Target Stoploss Order
Add Broker
Track
Futures OI
Options OI
News
Price & Volume
Alerts
Built-Up Breadth
Built-Up Scrip Symbol
Synopsis Futures OI
Built-Up Sectors
Top Stocks
Intraday Movers
Day's High-low widget
Analyze
Charts
IV
PCR
Expiry
Price & Volume
Charts/ Order & Trade
Multi Strike OI
O&T Watch List
Strategy Chart
Scan
Hist-Futures
Hist-Options
Pairs
Built-Up Scrip OI-Historical
Built-Up Sector Cycle
Built-Up Sector OI-Historical
Built-Up Scrip Cycle
Comparative Analysis
Tools
Easy Strategy
Strategy Builder
Quant Models
Essential Tools
Optimizer Find Strategy
Optimizer Find Specific
Optimizer My Forecasts
Optimizer Constrains
Learn
Live
Self Learning
Events
Webinars

Book a Session
Video Library
Video Library
Language
All
Proficiency
All
Speaker
All
Sort
All
-
Rollover
Nifty Prediction
Self Lerning
Future
Options Trading
Volume
Intraday Stock Options
Option Chain
Options Tarding
Options Trading Strategies
Strategies
Rollover Analysis
Option Buying
Volume Analysis
Technicals
Option Strategies
Technical Indicators
Optiond Trading
Pullback
Option Buying
Block Deal
Technical Analysis
Indicator
Options Writer
Options Strategies
Swing Trading
Strategy
Event Trading
Technical Chart
PCR
Orderbook Indicators
Intra Day
Orderbook
Implied Volatility(IV)
Ban
Trading
Scalping
Option Chain Analysis
EMA
Self Learning
Nifty Analysis
Optionstrading
Built-up
Moving Average
Options GTrading
Implies Volatility
Expiry Day Trading
Trap Indicator
Option Selling
Breakouts
Banknifty
Options Buying
Option Trading
Future Trading
Intraday
Options Trading
Options Buying
Options Selling
Strategy Optimizer
NSE Option Chain
Put Call Ratio
Volatility Trading
Option Greeks
Nifty
BankNifty
Implied Volatil;ity
Option Seling
Oi Built Up
Option Seeling
Implied Volatility
Backtesting
Market Sentiment
Futures
Open Interest
Positional Trading
Intraday Trading
Price Action Trading
Pair Trading
Index Trading
Risk Reward Ratio
Relative Performance
TrackFutures OIarrow_drop_down Options OIarrow_drop_down Price & Volumearrow_drop_down Alertsarrow_drop_down
AnalyzeChartsarrow_drop_down IVarrow_drop_down PCRarrow_drop_down Expiryarrow_drop_down Price & Volumearrow_drop_down
ScanHist-Futuresarrow_drop_down Hist-Optionsarrow_drop_down
ToolsEasy Strategyarrow_drop_down Strategy Builderarrow_drop_down Quant Modelsarrow_drop_down Essential Toolsarrow_drop_down
LearnSelf Learningarrow_drop_down

Buy Low
835 Likes 48404 Views 26 months ago
Option traders are found diligently monitoring market movers such as Nifty, BankNifty, or specific stocks within NSE's F&O segment. This pursuit demands a combination of technical analysis, sentiment assessment, and adept risk management. Many NSE traders rely on technical indicators and sophisticated tools to pinpoint entry levels for market scalping/investing.
Quantsapp possesses a quant-based tool designed to address the challenge of bottom fishing, presented in a user-friendly format to highlight potential opportunities for option and derivative traders. Through this tool, optimal lows within a specified look-back period are identified and depicted with distinctive green triangular markers, indicating potential market bottoms.
 Intermediate Level
 38 min
  Shubham Agarwal
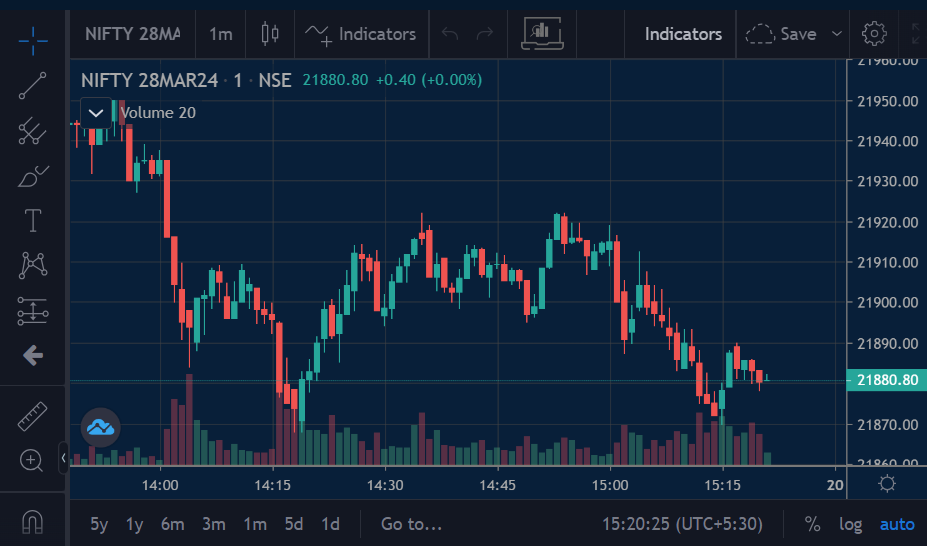
The Power of the New Orderbook Quant Indicator: Insights for Traders
583 Likes 26456 Views 19 months ago
Order and Trade Analytics
 Beginner Level 04:25 hr Diljeet Uppal
Order Book Data
8020 Likes 268896 Views 26 months ago
Every option trader in the Indian stock markets aspires to detect genuine price breakouts and steer clear of false signals, especially in indices such as Nifty or BankNifty. Achieving this can significantly enhance or refine their trading endeavours. The current necessity lies in discerning which market participant holds sway over the price dynamics. Are the bulls dominating the bears, or is it the other way around? Whether it stems from buying pressure or selling pressure??
Quantsapp has unique data analytics related to real time order and trade flow, (Order and Trade Book) that provides an edge to use complete order book data with any trading system. It helps understand the behaviour of Traders in real time by stepping into the data window which was earlier available only to institutional players. Typical prevalent order book is Best 5 participants on Bid and Ask, the proprietary algorithm of Quantsapp allows to scan the full order and trade book to enable better decision making.
Its real time order and trade book giving perspective about market mood, sudden spurts in buying or selling emanating in specific scrips.
Intermediate Level 02:12 hr Shubham Agarwal 
Relative Performance Graph
3404 Likes 304139 Views 26 months ago
Option traders and other derivative traders on NSE would like to pre-empt the large moves which are about to unfold in any particular underlying, especially stocks in F&O segment. How do traders spot them early and build an edge for their trading.
The efficacy and functionality of an important proprietary tool by Quantsapp, namely, Relative Performance Graph, helps in this regard.
With the graph space divided into quadrants, namely, weak, progressive, strong, Laggard. It indicates the momentum-based positioning of different scrips with Nifty or any other index like BankNifty etc., their respective state transitions from weak to progressive or strong to laggard, suggestive of a possible surge or drop in that particular scrip.
Intermediate Level 13:12 hr Shubham Agarwal 
Trap Indicator
774 Likes 34393 Views 26 months ago
Trap Indicator is a proprietary algorithm of Quantsapp which searches for securities or indices where the call writers or put writers are getting trapped, with prices of securities turning bullish or bearish respectively, hence hurting the writers. These writers would go ahead and unwind their positions which could result in a further momentum-laden move in that respective security/index.
Intermediate Level 01:11 hr Shubham Agarwal 
Option Writer
1442 Likes 64425 Views 26 months ago
Option writing involves predicting the ideal trading range for the underlying asset, which may include indices such as Nifty, BankNifty, or stocks listed in the F&O segment on NSE. There are numerous indicators to assist in gaining an advantage in option writing or selling.
Intermediate Level 13 hr Shubham Agarwal 
Put Call Ratio
192 Likes 7109 Views 26 months ago
When determining whether the put side or call side is dominant, the Put-Call Ratio (PCR) serves as a valuable tool for interpreting the sentiment within derivative markets. Traders consistently track diverse indicators to assess market sentiment and formulate informed trading strategies. Quantsapp helps with its comprehensive range of tools associated with PCR, enabling the identification of subtleties within underlying assets such as Nifty, BankNifty, and others.
Intermediate Level 05:38 hr Varun Shetty 
Volatility Trader
822 Likes 35688 Views 26 months ago
Greed and fear are factors that contribute to markets’ overall investing mentality or sentiment, influenced by behavioural biases. Volatility in Options trading is as important as the direction of the stock or index like Nifty, Bank Nifty or any other stock in NSE derivatives segment. Implied volatility, is a measure of future volatility expectations of an asset like a stock or an index like Nifty or BankNifty etc.
Intermediate Level 04:27 hr Shubham Agarwal 
Sector Seasonality
244 Likes 6986 Views 26 months ago
Stock market seasonality pertains to the recurring patterns and trends observed in market behaviour, including fluctuations in performance, trading volume, and investor sentiment during specific times of the year. These patterns may be influenced by seasonal changes or regular events occurring in particular months, for example pertaining to Indian derivatives markets, price action on NSE is influenced by monsoon factor, or the onset of South-west monsoon.
Analyzing seasonality can help identify potential market trends, but it's important to complement this analysis with other technical or derivative data indicators.
For insight into such market sentiments, Quantsapp offers its dedicated Seasonality tool.
Beginner Level 08:43 hr Varun Shetty 
Intraday Movers
380 Likes 14779 Views 26 months ago
Intraday Movers tool within Quantsapp empowers option traders and derivative traders on the NSE to assess the leading performers in the derivatives segment. This platform provides functionalities for scrutinizing stocks according to factors like the percentage change in NSE futures prices and open interest. By analyzing real-time market data, traders can pinpoint these movers.
According to the dynamics of price-open interest, the screen displays a bubble chart divided into quadrants. An increase in open interest (OI) suggests long built-up, provided that the price of the respective futures is also rising.
Similarly, the other quadrants are labelled as long unwinding, Short and Short covering based on the price and OI relationship.
Beginner Level 07:09 hr Varun Shetty 
Optimizer: Find an Optimal Strategy for your Option Trading Forecast
723 Likes 27257 Views 24 months ago
Why is options trading different from shares trading or futures trading? Options are financial tools with non-linear payoffs, particularly influenced by movements in the underlying assets, such as Nifty and BankNifty indices or stocks within the NSE F&O segment. Analyzing the behaviour and dynamics between options and their underlying assets requires a comprehension and thorough understanding of option greeks. Understanding option greeks and their implications for trading strategies is crucial,
Beginner Level 06:11 hr Shubham Agarwal 
Trade Recap
16 Likes 918 Views 26 months ago
Option traders, both in the Indian stock markets and worldwide, dedicate a significant amount of time and effort to forecasting the direction of Nifty or the index for the following day. Despite accurately anticipating the movement of the underlying asset, option traders on NSE frequently struggle to produce substantial returns.
Intermediate Level 01:02 hr Varun Shetty 
Open Interest
616 Likes 19647 Views 26 months ago
Open interest represents the quantity of unresolved or outstanding contracts for a specific
derivative instrument, serving as a metric to assess trader involvement in an underlying
asset. This analysis can be done effectively, for various F&O stocks and listed equity indices
on NSE in India, using Quantsapp.
In examining NSE options' open interest data, the focus shifts to the viewpoint of option
sellers or writers, who typically possess substantial resources and shrewd insights. Option
selling entails assuming unlimited risk for limited reward, confined to the option premium and
is subject to initial margin requirements set by exchanges.
Quantsapp's options open interest tool offers option traders insights into open interest levels
across various strike prices of Nifty, BankNifty, or specific F&O stocks, depending on the
underlying asset being analyzed.
Intermediate Level 15:19 hr Varun Shetty 
Options Architect
825 Likes 32584 Views 26 months ago
Options are non-linear payoff products, where the payoffs of an options trading strategy on NSE is not just dependent on price, but also on time to expiration of the derivative contract and volatility prevailing in the underlying.
A tool for building variety of options trading strategies, single legged or multi-legged strategies and observing their payoffs, i.e. profit and loss scenarios not just on expiry but also at varied instances under varying implied volatility and varying days to expiry.
The tool effectively helps option traders on NSE, to understand the influencing greeks, ranging from first order to higher order option greeks at a click, helping them to understand how this could impact their strategy. Index options like Nifty, BankNifty etc. or stock options which are listed in F&O segment on NSE and risk associated with variety of options trading strategies be effectively studied.
Intermediate Level 08:23 hr Varun Shetty 
Order & Trade Watchlist
474 Likes 17978 Views 26 months ago
O&T Watch List
Intermediate Level 07:48 hr Varun Shetty 
Advance Decline Chart
74 Likes 2888 Views 26 months ago
The Advance Decline chart, a tool within Quantsapp utilized in the Indian stock market, gauges the breadth of a market's movement. It aids investors and traders in evaluating the overall strength or weakness of a market by monitoring the number of advancing and declining stocks, thus determining the net advances.
Here's how it functions:
Advance: When a stock's closing price exceeds the previous day's close, it's considered an advancing stock.
Decline: Conversely, when a stock's closing price is lower than the prior day's close, it's considered a declining stock.
Beginner Level 01:55 hr Varun Shetty 
Ready for Breakouts? | Track Participation to Validate Moves |
699 Likes 23861 Views 22 months ago
Options trading entails risk, necessitating traders to develop a comprehensive strategy, risk management plan, and thorough understanding of market conditions.
Breakout trading is a prevalent strategy in options trading, aiming to identify and capitalize on significant market price shifts. This method is based on momentum, aiming to capture gains from sudden and substantial price changes typically following a prolonged period of consolidation or trading within a specific range.
Beginner Level 13:14 hr Bhavin Desai 
Participant Data
137 Likes 4770 Views 26 months ago
Participant data plays a crucial role in comprehending and analyzing the operations of Indian stock and derivative markets. It serves as a fundamental aspect for making informed decisions by option traders and other derivative market participants.
Indian stock and derivative markets draw a diverse array of players, encompassing individual retail investors, institutional investors like mutual funds, insurance companies, foreign institutional investors (FIIs), domestic institutional investors (DIIs), proprietary trading firms, and market makers
Beginner Level 02:11 hr Varun Shetty