Login

Option Open Interest structures

Chapter 8

Option Open Interest structures

As discussed earlier, the open interest data is studied from option sellers’ perspective, because they are the traders/participants with deep pockets, as option selling involves taking unlimited risk and limited reward, i.e. restricted to option premium and also exchanges stipulate an initial margin requirement. With such a payoff structure, it suggests that they know the market better (probably) to assume a negative risk reward.

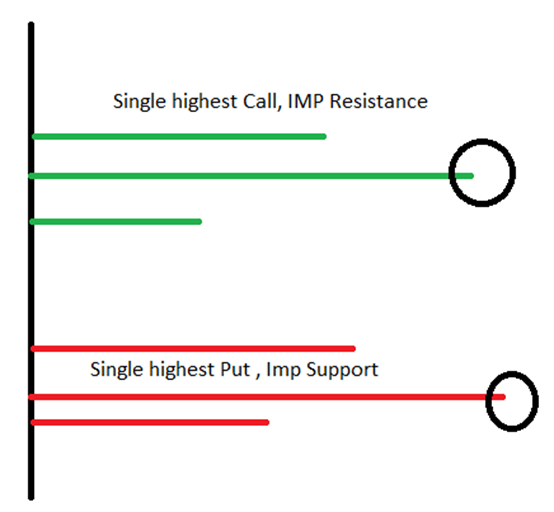
Now, when a large set of option traders write call option of a particular strike, making that as the single highest call from OI perspective. Then, that implies, traders are betting that prices of the underlying will not cross that stated level and this level develops as a single important technical resistance.

Similarly, puts are written at a single particular strike by option sellers, suggestive of an important technical support, as traders expect prices to hover above this level and not break this strike price.

This has been shown ahead in a template.

How important resistance and support are spotted based on open interest snap shot of the underlying.

If the options open interest structure suggests that there is an accumulation of call writers at higher strike prices as shown in the template ahead, suggests that multiple resistances exist for the underlying which is being studied, be it Nifty or F&O Stock.

While in the same template, if the put writers are concentrated at one strike price, then that single put with dominating open interest should act as a strong support, on the break down of which, the stock could fall rapidly.

Snap shot of open interest showing multiple resistances and a single strong support.

Looking at the open interest template ahead, we notice that there is a very light call OI on varied strikes while the open interest tends to be large and concentrated around varied strikes. This is suggestive that call writers or option sellers/writers aren’t confident of selling calls but at the same time the option traders have aggressively sold put options at nearby concentrated strike prices, which gives the underlying, a stubborn and strong multiple support zone, if the underlying stock were to fall.

So, a strong support and stronger participation at the puts coupled with limited writing of the calls, suggests a bullish undertone for the underlying Nifty or F&O stock under study.

Light call accumulation of open interest and more aggressive put writing across different strikes, suggestive of multiple strong supports.

If option traders are selling puts and calls of approximately the same quantum at different strike prices which aren’t concentrated, but spread across, as shown in the template ahead, suggests that the traders are expecting volatile or wild moves for the underlying under study, where such an open interest structure has been observed.

Both calls and puts written equally aggressively at varied strike prices, suggestive of wild volatile move emerging.

Where’s the money? Show me the moolah!

A lot can be studied and deciphered from open interest structures of options, for different strike prices of Nifty or F&O related stocks.

The most useful pattern or structure observed in open interest is when the option writers, are concentrated at a single strike with a single option type, either a call or a put.

If the prices were to rise above this technical resistance (highest OI call, as mentioned earlier), implying resistance has been broken, which could lead these call writers or call option sellers to run for cover, implying squaring off their sell position, it would result in a sharp surge in the call option price resulting in a sharp surge. Ah! Do we smell a possible money maker??

Yes, at times the option premium surge rapidly within minutes of the sustained breach of the technical resistance.

FAQs

What is option open interest structure?

The pattern in which open interest built-up has occurred across strike prices for the options of a specific underlying, suggests its structure, i.e., if the calls and puts are concentrated across a specific strike price or they are concentrated across multiple strikes etc.

How does one identify resistance and support in an equity derivative using open interest data?

The largest OI Call option should act as resistance and the highest OI put option should act as a support.

How does one detect a possibility of a sharp surge in option prices using open interest data?

When the futures prices are close to the highest, single concentrated OI strike call or put and breaches that level either on the upper end (for calls) or on the lower end (for puts), a possible surge in the respective option price occurs.

What if call OI is greater than put OI?

This suggests that the equity derivative has strong support and put option sellers have aggressively written/sold the puts with expectations that the underlying will not break the support zone.