Implied volatility, as discussed in the previous chapter is mean reverting. The observation is also, visible from the below chart.
Ideas
Ideas
.svg)
Intel Junction
Trade
Trade
Orders API
Watchlist
Orders
Positions
Broker Access
Hot Keys
Alert Trigger Order (ATO)
Bracket Order
Target Stoploss Order
Add Broker
Track
Futures OI
Options OI
News
Price & Volume
Alerts
Built-Up Breadth
Built-Up Scrip Symbol
Synopsis Futures OI
Built-Up Sectors
Top Stocks
Intraday Movers
Analyze
Charts
IV
PCR
Expiry
Price & Volume
Charts/ Order & Trade
Multi Strike OI
O&T Watch List
Strategy Chart
Scan
Hist-Futures
Hist-Options
Pairs
Built-Up Scrip OI-Historical
Built-Up Sector Cycle
Built-Up Sector OI-Historical
Built-Up Scrip Cycle
Comparative Analysis
Tools
Easy Strategy
Strategy Builder
Quant Models
Essential Tools
Optimizer Find Strategy
Optimizer Find Specific
Optimizer My Forecasts
Optimizer Constrains
Learn
Live
Self Learning
Events
Webinars

Book a Session


Chapter 5
Relative Positioning of Implied Volatility - (IVR) & (IVP)

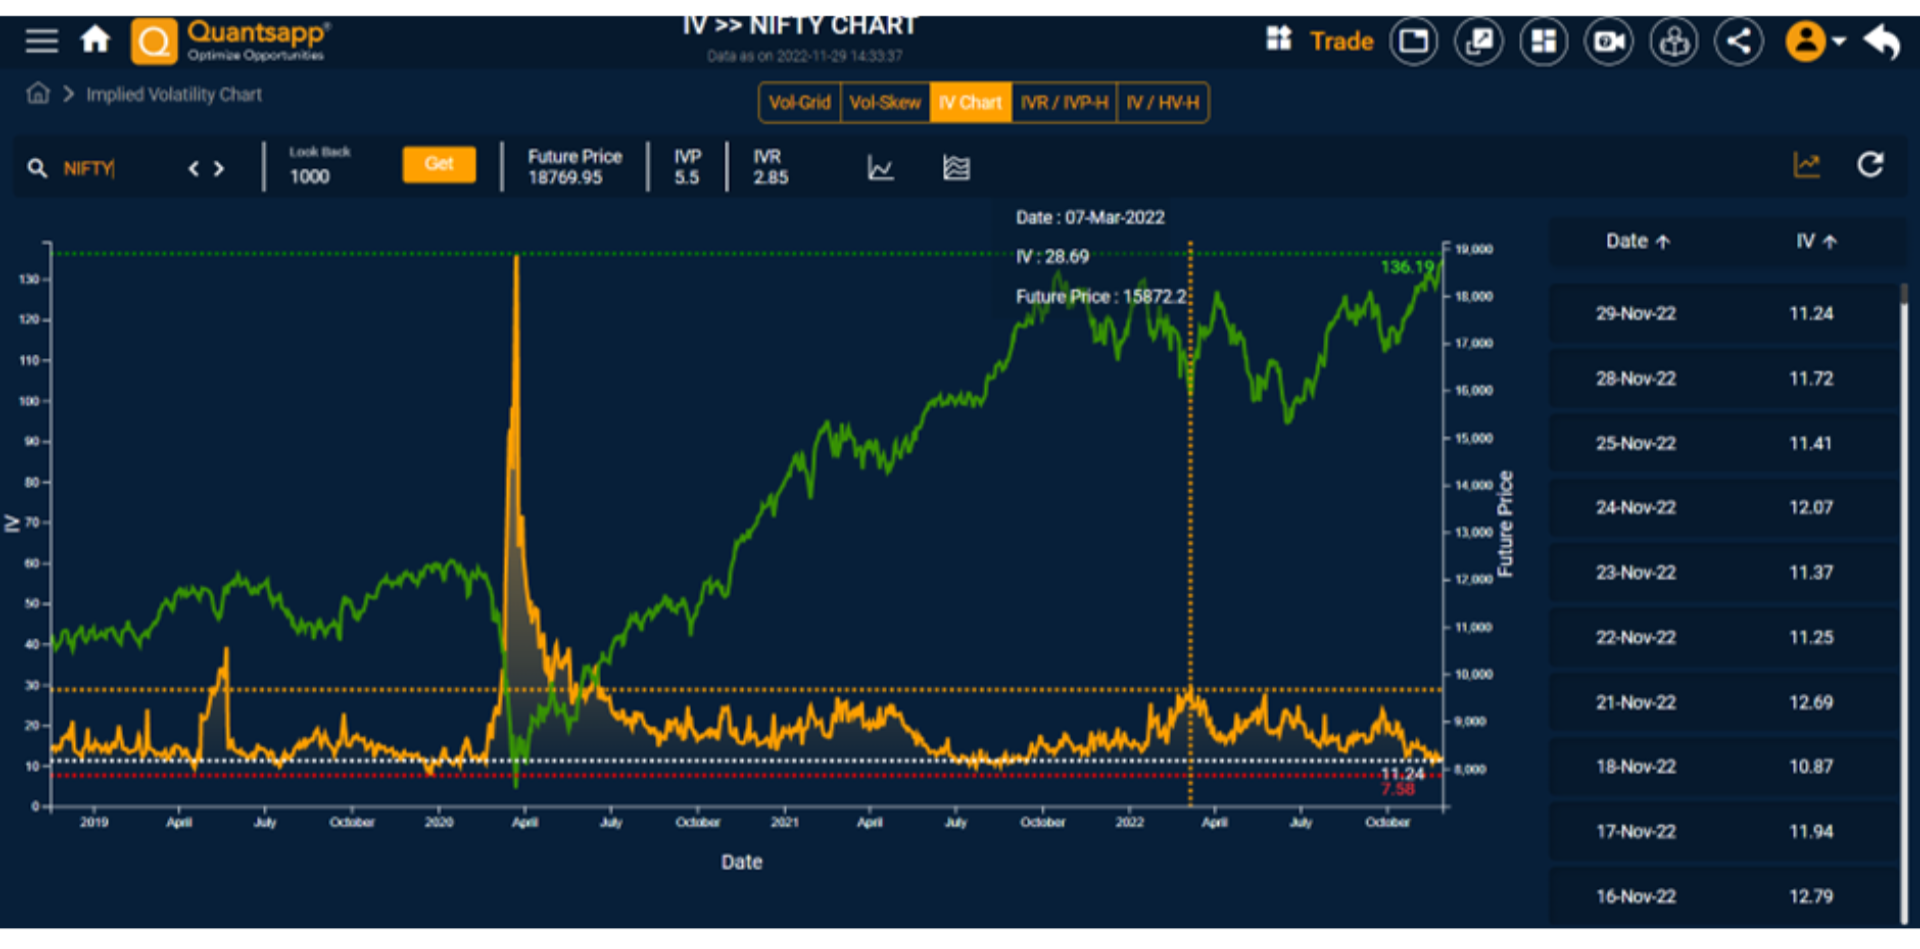
The spike witnessed in implied volatility towards end of March 2020, due to COVID concerns; scaling highs of about 136%, quickly fizzled out to lower levels, where it continues to oscillate.
IVR and IVP help in finding the positioning of IV amidst historical lookback period. Is it on the higher end of the mean reverting range or lower end? IVR and IVP help in answering the question posed and also help in identifying volatility extremes.
Implied Volatility Rank (IVR)
Implied Volatility Rank compares the current IV of the underlying (Nifty, Bank Nifty or F&O stocks) to its IV range over a pre-defined look-back period. If the number of trading days is assumed to be about 250 as a look-back period, corresponding to approximately, a year. So, the IVR takes into account the high and low of those 250 days and then compares the positioning of current IV, within that defined range.

IV High – IV Low is the range IV has taken during the past 1 year or a lock-back period of 250 days.
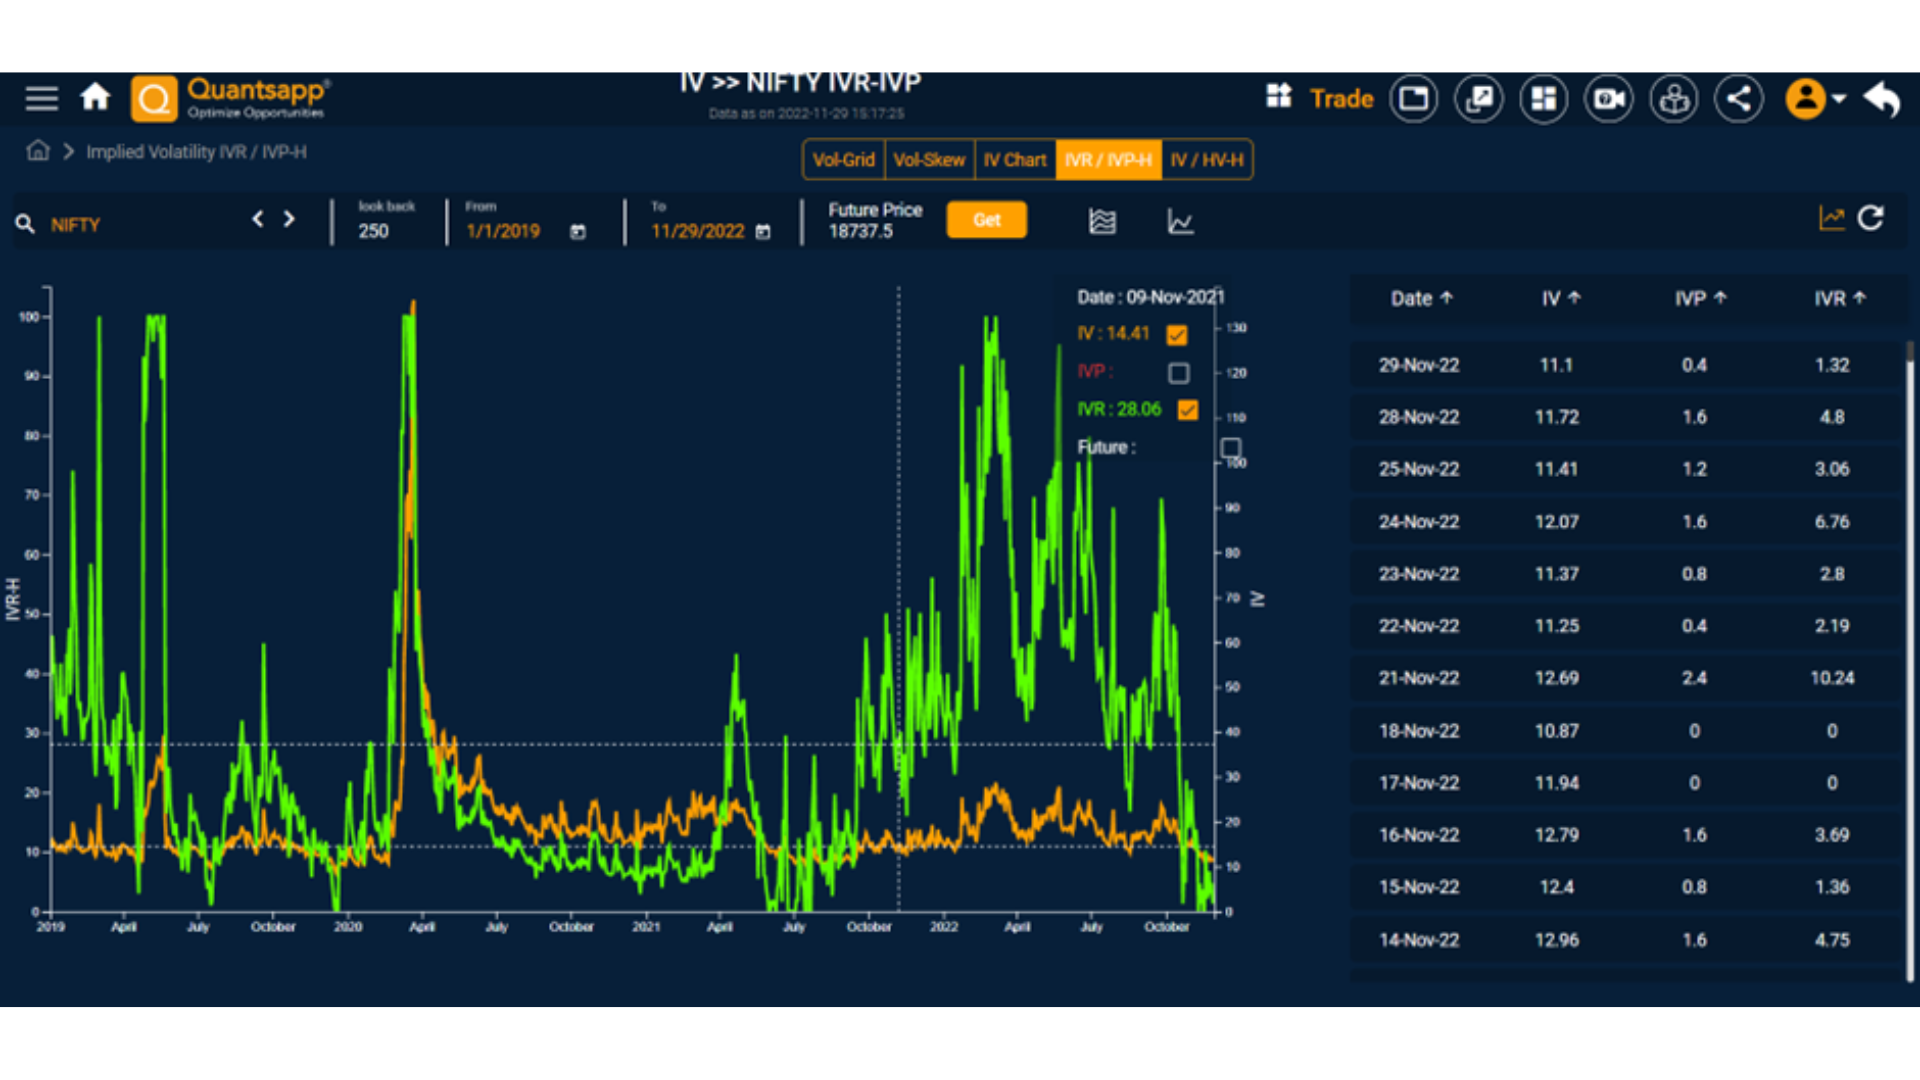
The chart above exhibits the behaviour of IVR along with IV of NIFTY.
Implied Volatility Percentile (IVP)
Implied volatility percentile (IVP) gives the number of days in the past that the underlying’s IV was lower than its current IV during the pre-defined look-back period, in percentage terms.

Note: Here 250 is the pre-defined look-back period, as stated earlier.
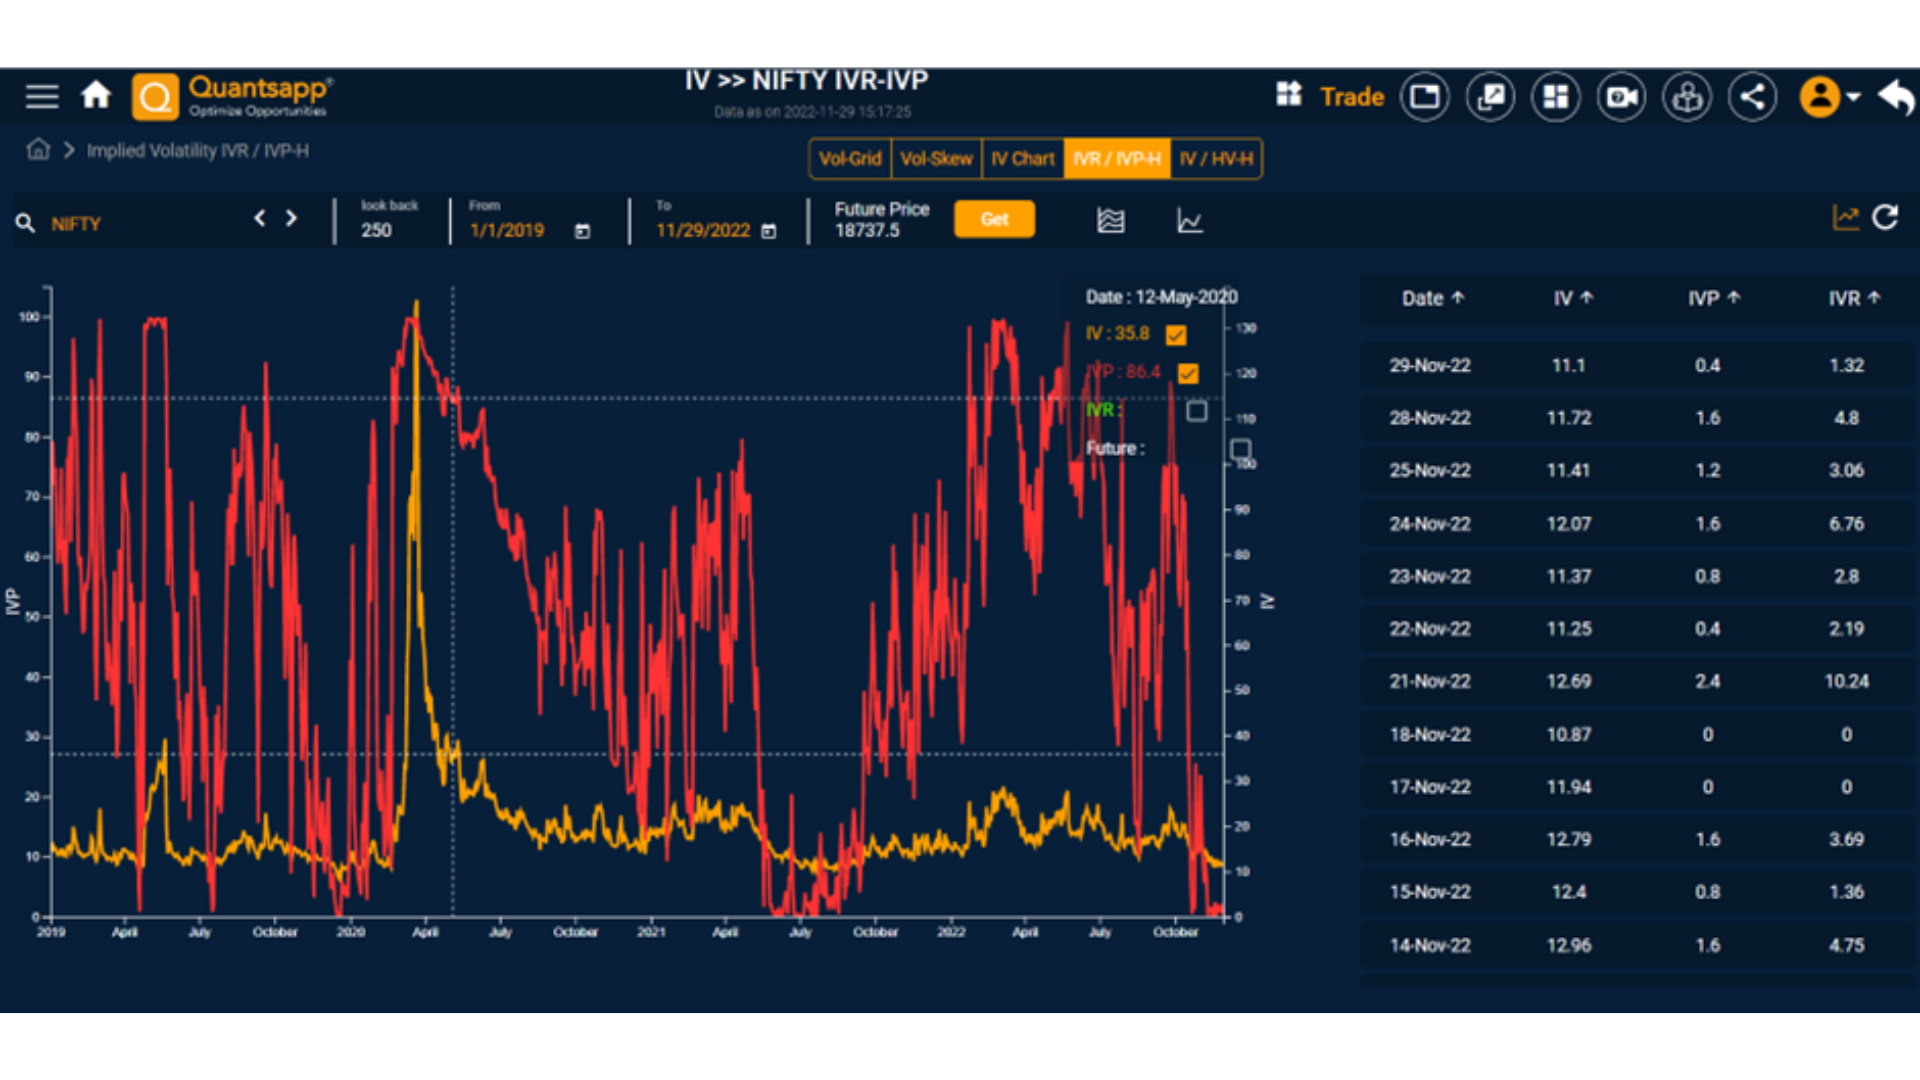
The chart above exhibits the behaviour of IVP along with IV of NIFTY.
Comparison of IVR and IVP
One of the issues with IVR is that if a stock’s IV spikes to an extremely high level, due to some event risk like war, COVID, etc, almost all IVR readings moving ahead will be low, even if the stock’s current IV is still relatively high, as it is comparing it, time and again with the extremely high level (spike level) of volatility, during the lookback period.
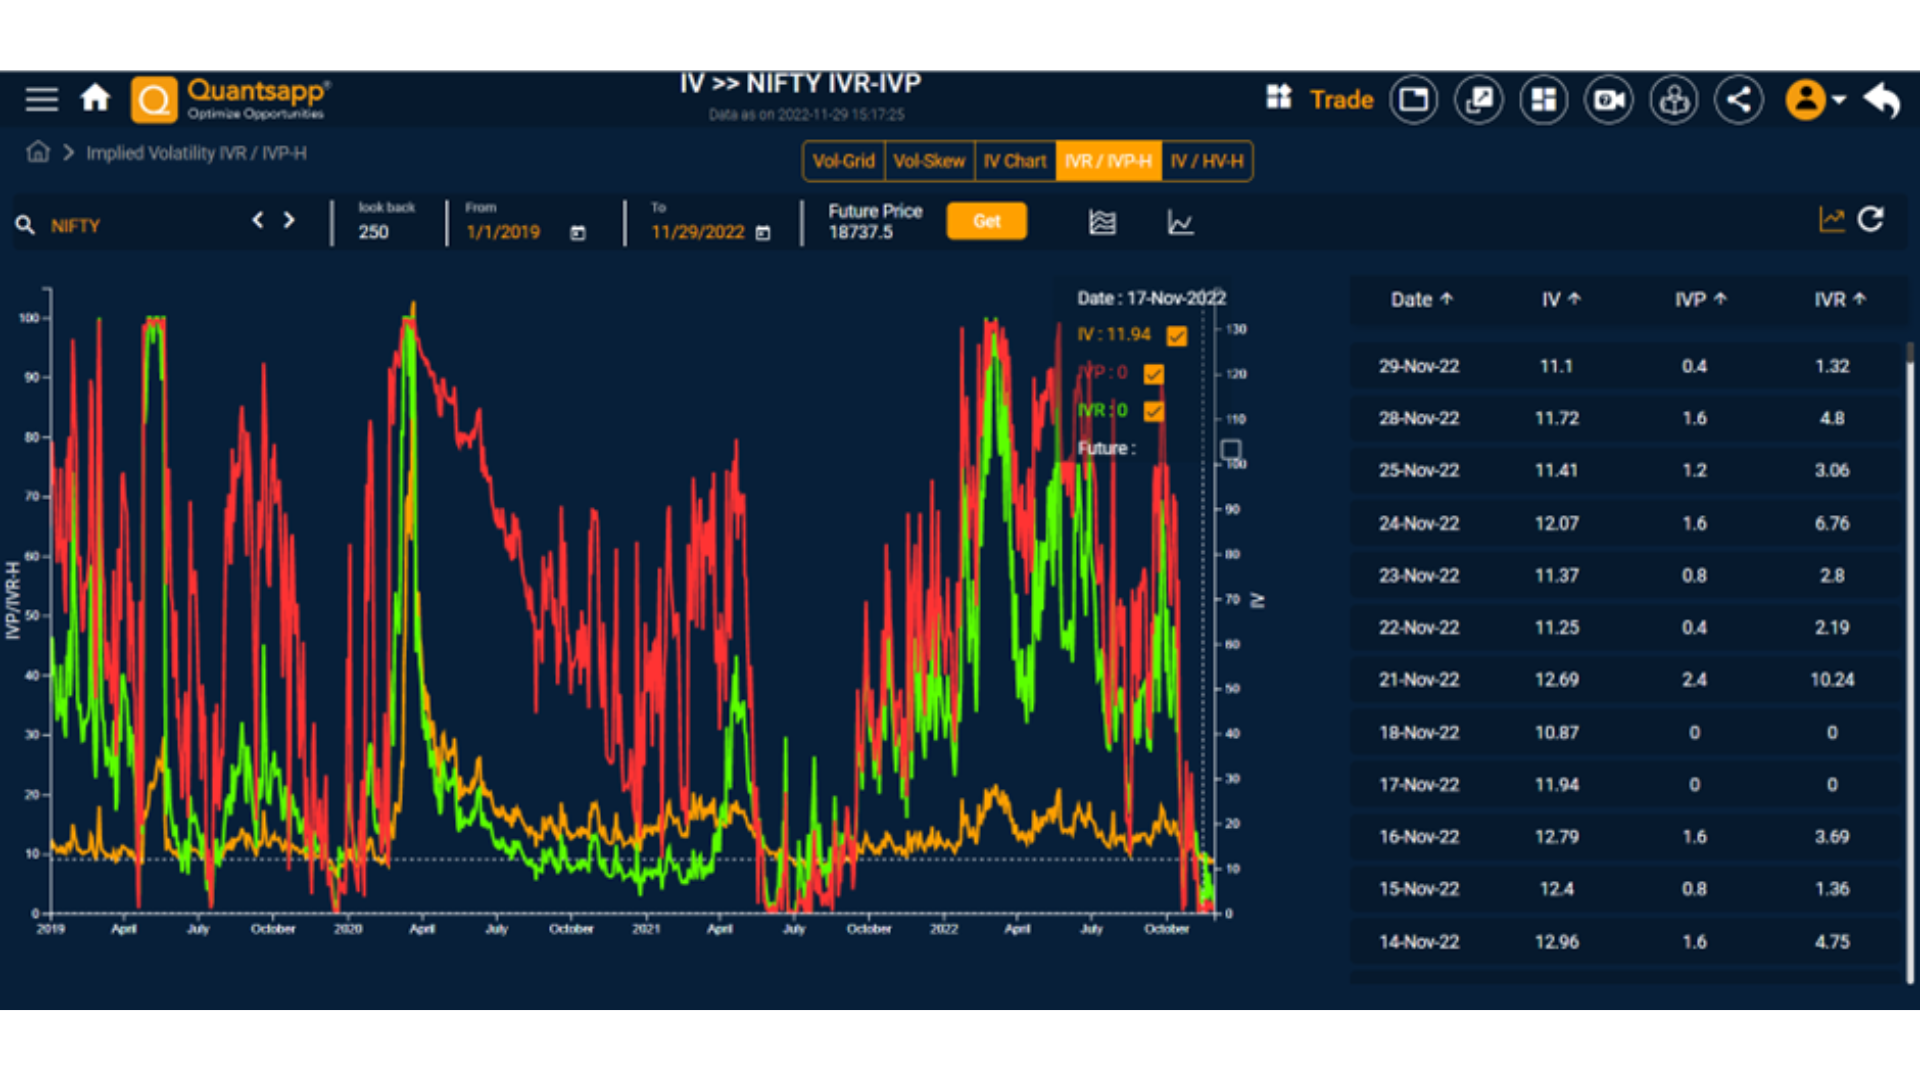
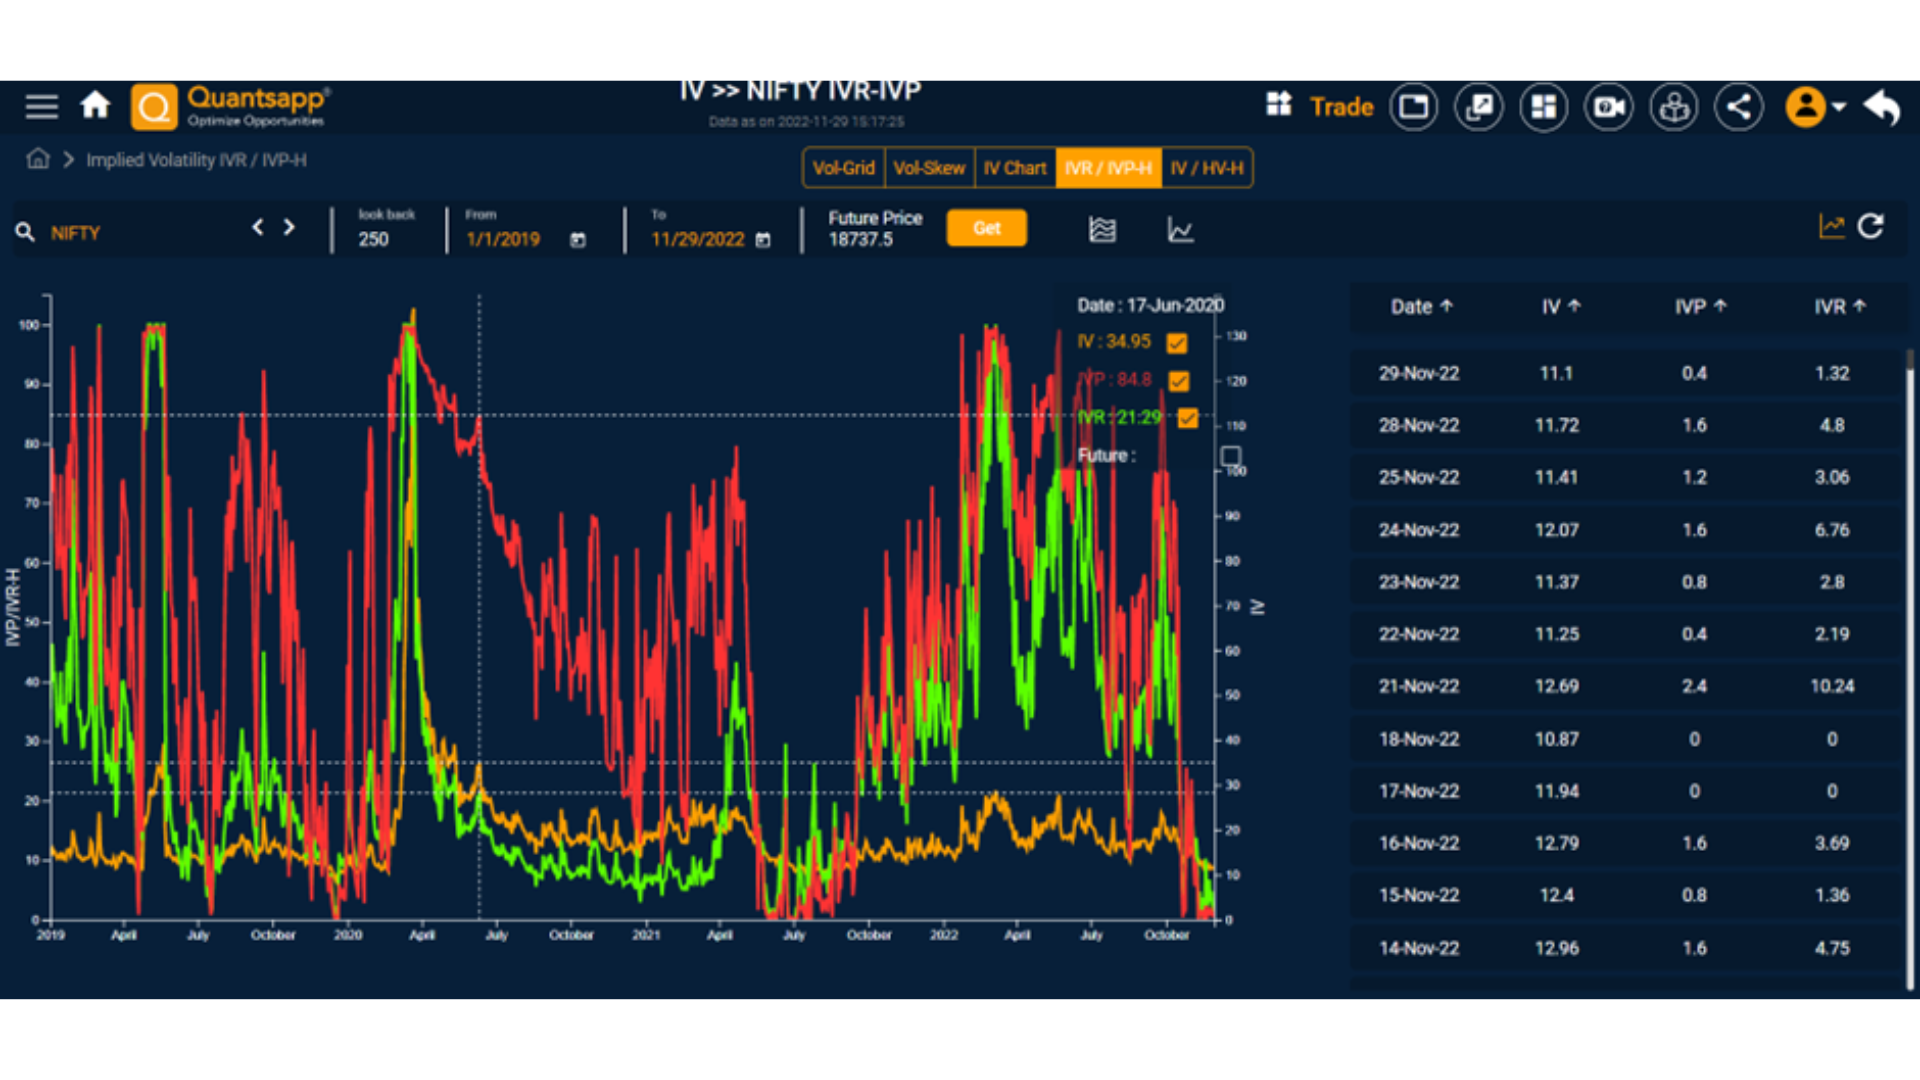
As is observed in the above chart, in green is the reading of IVR, while red is the reading for IVP and orange being IV. After the COVID spike of volatility, the green line remains suppressed over an extended period of time, while IVP in such a case proves to be a better statistic.
For example, on 17 June 2020, Nifty IV was at 35%, which was relatively high, but IVR was fixated with the peak value of 136% of 24 March 2020 and IVR was at 21.29, while IVP was at 84.80, as it counted the peak (spike) as “one” of the high volatility days, in its count of days. We recollect, that IV percentile tells us the percentage of days over the 250 days, when IV was lower than its current IV level. So, when there is unusual spike in IV due to an known event like Result or unknown event like COVID outbreak , IVP is better than IVR, as it shows it first, as it is a better “mean-reversion” indicator.
FAQs
What does a high IV rank mean?
IV Rank is the relative positioning of current implied volatility of underlying like Nifty, Bank Nifty or F&O stocks, relative to the highest and lowest values over the past 1-year. If IV Rank is 100%, this implies that IV is at the highest level in the past look back period. So, a high IV rank means, the current implied volatility is close to the highest values.
Which is better: IV rank or IV percentile?
During an extreme high volatility spike, IV percentile is found to be better than IV rank. As one of the issues with IVR is that if a stock’s IV spikes to an extremely high level, due to some event risk, almost all IVR readings moving ahead will be low, even if the stock’s current IV is still relatively high, as it is comparing it, with the extremely high level (spike level) of volatility, during the lookback period. Otherwise, both are equally popular but not comprehensive as indicators of relative positioning.
What is low IV rank?
IV Rank is the relative positioning of current implied volatility of underlying like Nifty, Bank Nifty or F&O stocks, relative to the highest and lowest values over the past 1-year. So, a low IV rank means, the current implied volatility is close to the lowest values, during the pre-defined look-back period.
Is IV rank the same as IV percentile?
No. IV Rank is the relative positioning of current implied volatility of underlying like Nifty, Bank Nifty or F&O stocks, relative to the highest and lowest values over the past 1-year, or a pre-defined look-back period, while, Implied volatility percentile (IVP) gives the number of days in the past that the underlying’s IV was lower than its current IV during the pre-defined look-back period, in percentage terms. One takes into account the range (high and low) and the other takes into account # of observations.
How do you find the percentile for implied volatility?
The formula to calculate IVP is stated below (assuming a period of 250 days)